Australian Capital Territory · 1–31 October 2026
All-ad base: 1,036. Without recorded skills: 0.
Updated 19 November 2026 · Lightcast · Latest figures
Monthly report published · Validated refresh 19 November 2026
These figures use the latest validated refresh. The official monthly reports keep their figures as published.
Observed postings through 17 November 2026. Source completeness is unconfirmed. Daily website refresh is separate from monthly editorial publication.
Share of technology job ads naming an AI skill. October 2026. Data source: Lightcast.
Read the supporting evidence →01
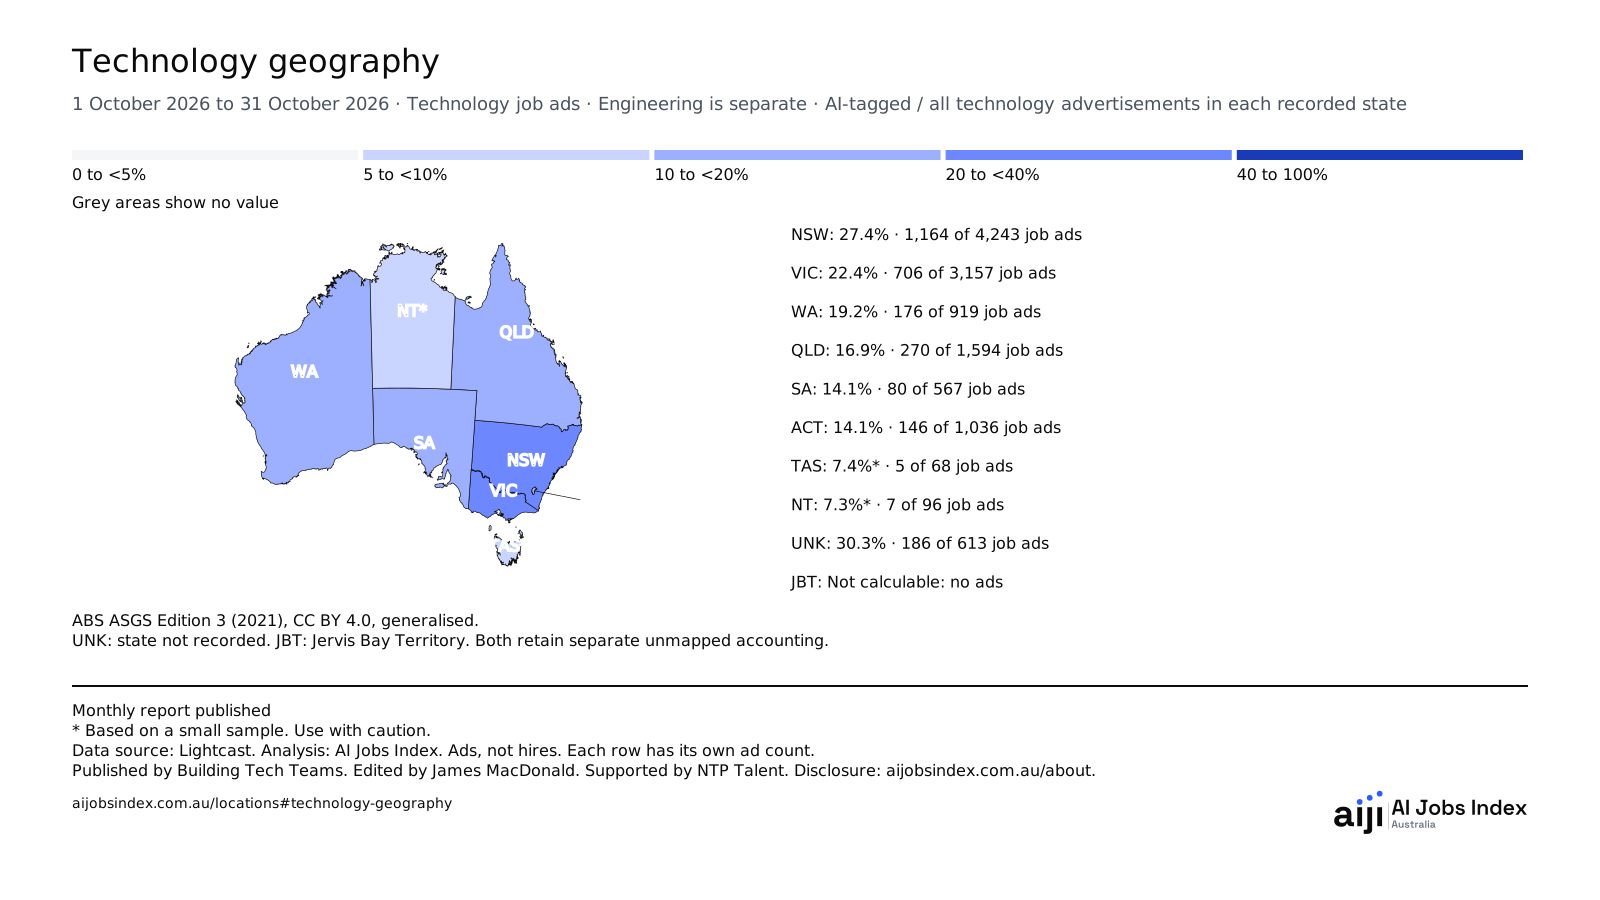
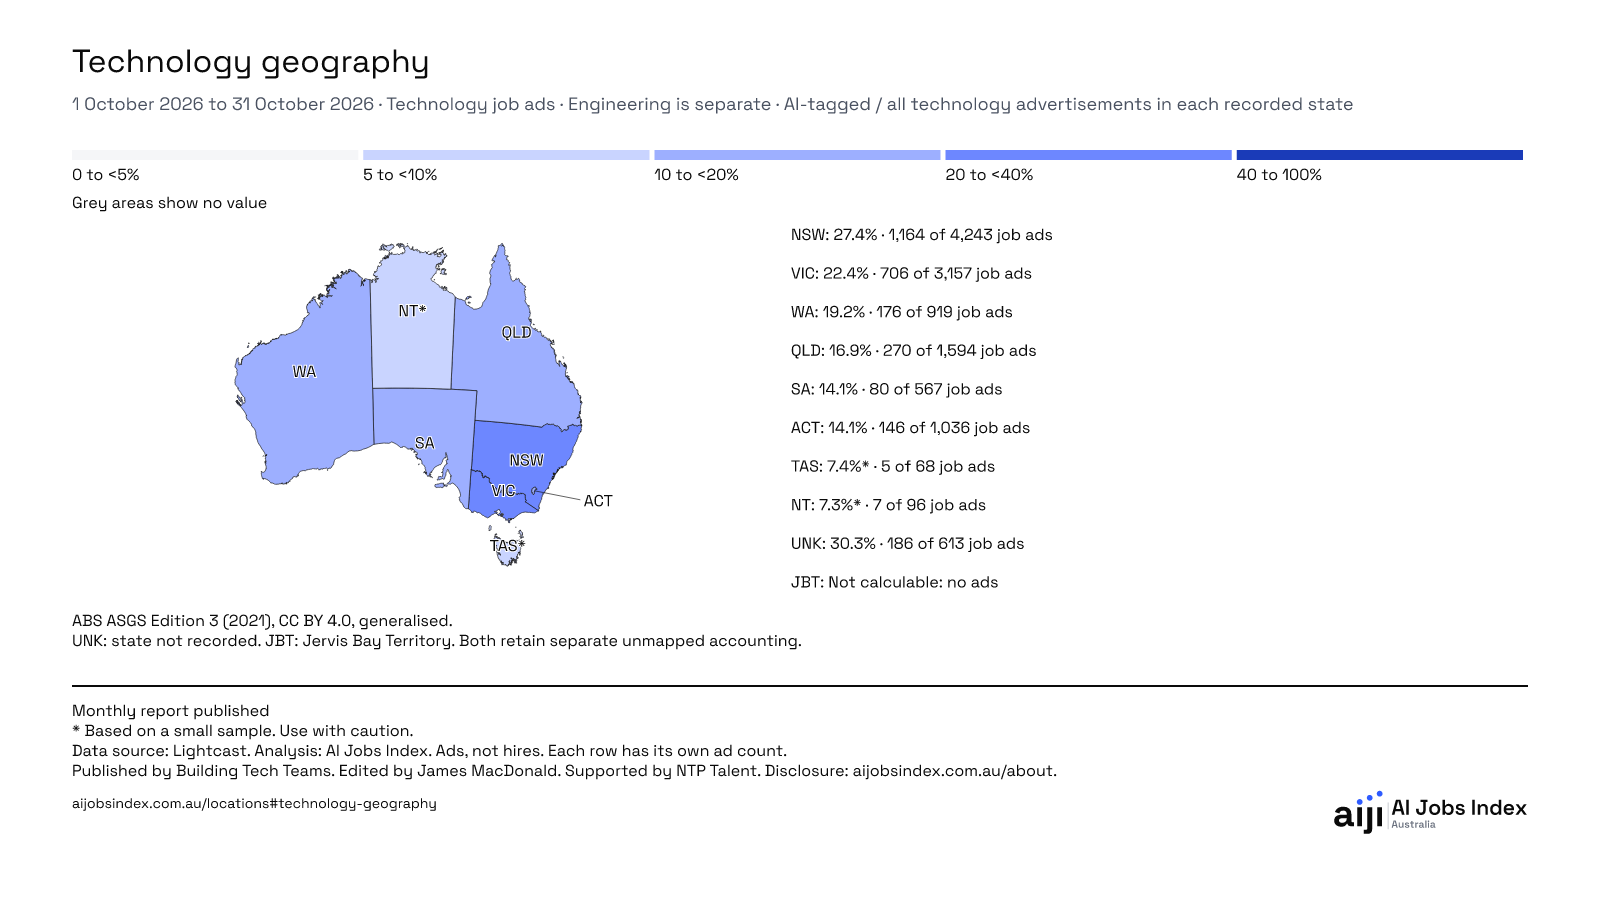
New South Wales had the highest published AI skill share in technology job ads in October 2026, at 27.4%.
Technology job ads. October 2026. Data source: Lightcast.
* Based on a small sample. Use with caution.
Share of technology job ads that recorded an AI skill, by state or territory.
Map boundaries: ABS ASGS Edition 3 (2021), CC BY 4.0, generalised.
| Recorded location | AI-tagged ads | All technology ads | AI skill share |
|---|---|---|---|
| New South Wales | 1,164 | 4,243 | 27.4% |
| Victoria | 706 | 3,157 | 22.4% |
| Western Australia | 176 | 919 | 19.2% |
| Queensland | 270 | 1,594 | 16.9% |
| South Australia | 80 | 567 | 14.1% |
| Australian Capital Territory | 146 | 1,036 | 14.1% |
| Tasmania | 5* | 68 | 7.4%* |
| Northern Territory | 7* | 96 | 7.3%* |
| State not recorded Unmapped national accounting | 186 | 613 | 30.3% |
| Jervis Bay Territory Unmapped national accounting | 0 | 0 | Not calculable: no ads No advertisements in this population and period. |
* Based on a small sample. Use with caution.
ABS ASGS Edition 3 (2021), CC BY 4.0, generalised. Unknown state and Jervis Bay retain separate unmapped accounting.
Location definitions and accounting. Unmapped locations stay in the evidence table.
Citation
AI Jobs Index Australia. Technology geography. Information Technology and Computer Science · Engineering is separate · AI-tagged / all technology advertisements in each recorded state. Period: 1 October 2026 to 31 October 2026. Validated refresh 19 November 2026. Accessed 20 November 2026. Data source: Lightcast. Observed postings through 17 November 2026. Source delivery 19 November 2026. Published by Building Tech Teams. https://www.aijobsindex.com.au/locations#technology-geography
Latest full calendar month. Missing or protected readings stay on this month, not an earlier map. Unknown locations and Jervis Bay are reported separately.
1,164 matching / 4,243 advertisements Highest eligible share of technology job ads naming an AI skill among states and territories in the latest full month.
All-ad base: 1,036. Without recorded skills: 0.
All-ad base: 0. Without recorded skills: 0.
All-ad base: 4,243. Without recorded skills: 12*.
All-ad base: 96. Without recorded skills: 1*.
All-ad base: 1,594. Without recorded skills: 8*.
All-ad base: 567. Without recorded skills: 3*.
All-ad base: 68. Without recorded skills: 1*.
All-ad base: 613. Without recorded skills: 2*.
All-ad base: 3,157. Without recorded skills: 7*.
All-ad base: 919. Without recorded skills: 2*.
Click on each state for state-by-state data.
02
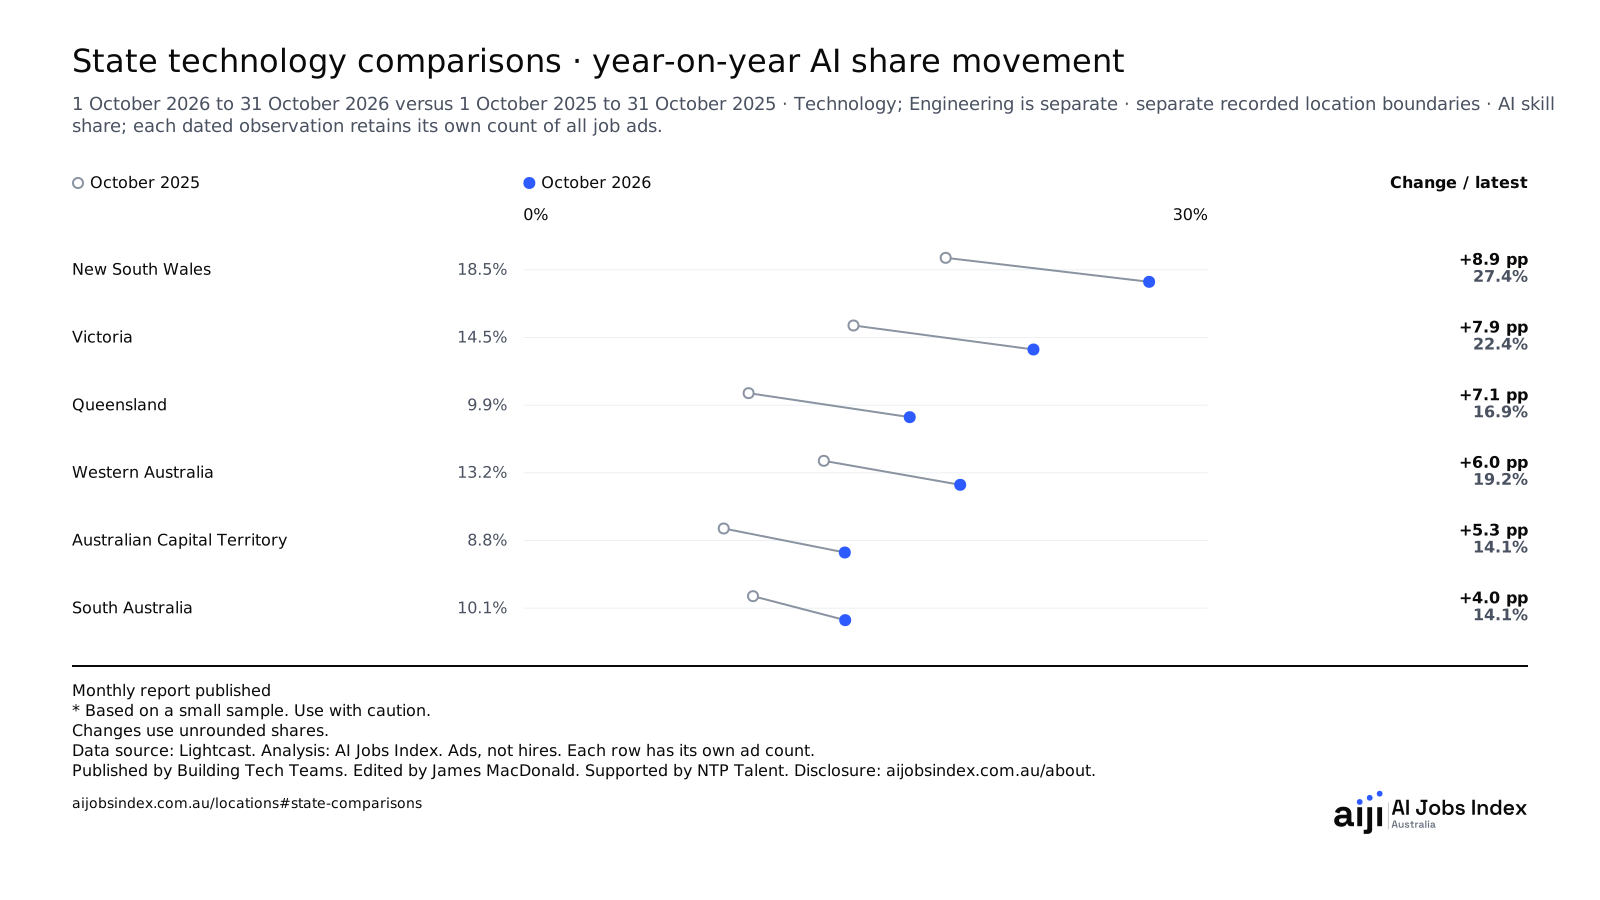
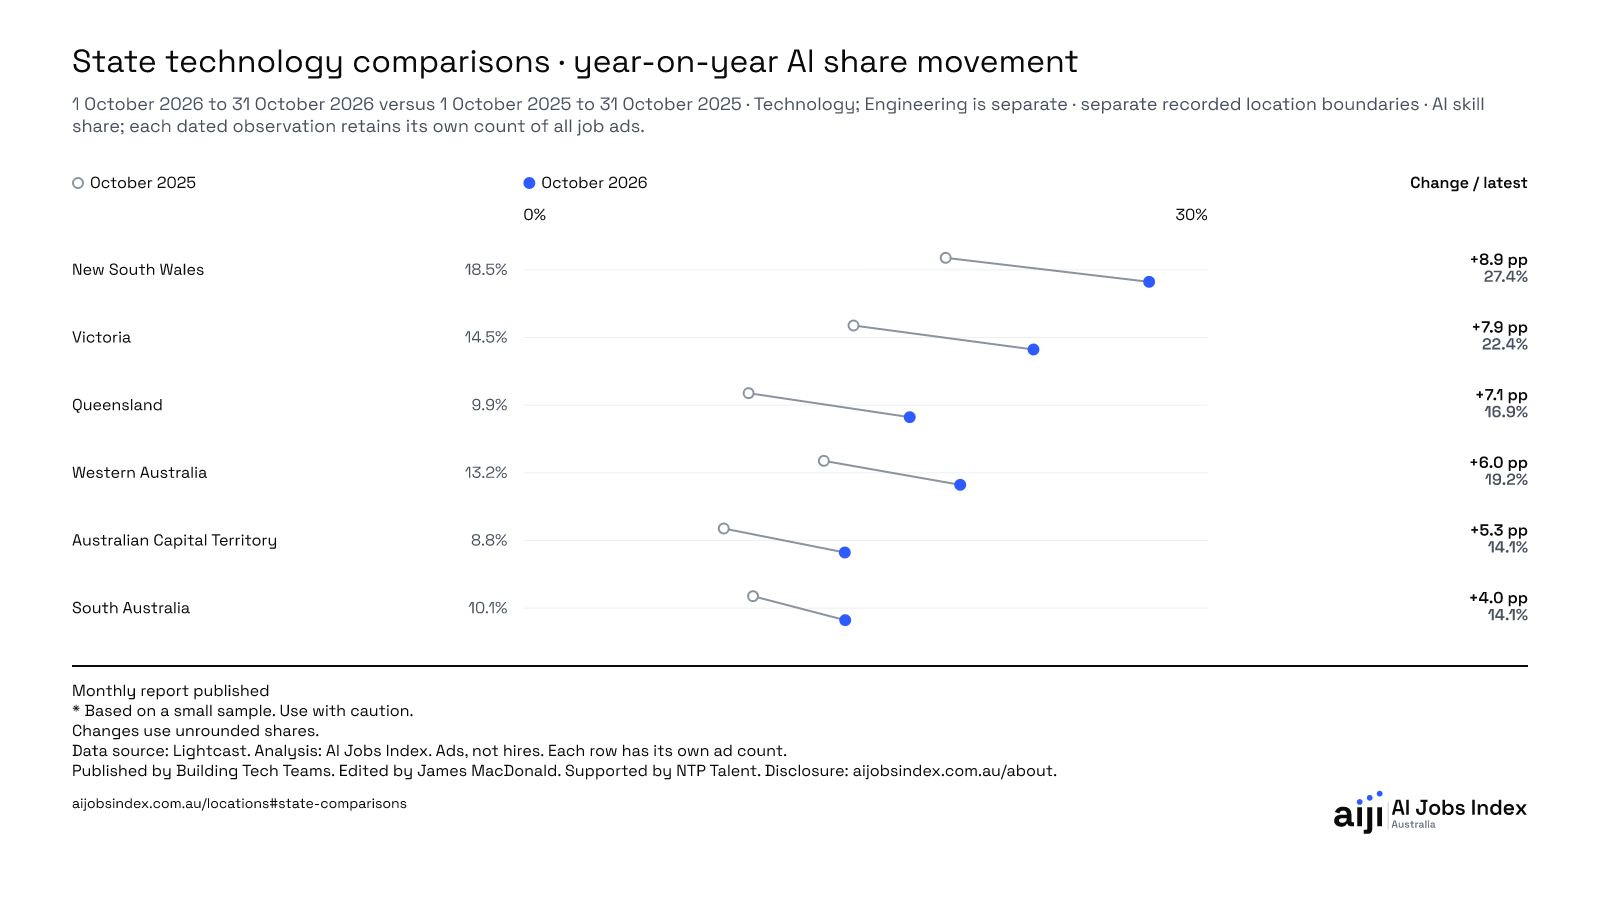
For New South Wales, the share rose from 18.5% to 27.4% (+8.9 percentage points).
Technology job ads. October 2026 versus October 2025. Data source: Lightcast.
There are too few ads in the Northern Territory and Tasmania for a year-on-year comparison. See Data and citation for the monthly readings.
Change uses unrounded shares.
| Location | October 2025 | October 2026 | Change (percentage points) |
|---|---|---|---|
| New South Wales | October 2025: 18.5% 700 of 3,781 job ads | October 2026: 27.4% 1,164 of 4,243 job ads | Change (percentage points): +8.9 pp |
| Victoria | October 2025: 14.5% 354 of 2,446 job ads | October 2026: 22.4% 706 of 3,157 job ads | Change (percentage points): +7.9 pp |
| Queensland | October 2025: 9.9% 150 of 1,519 job ads | October 2026: 16.9% 270 of 1,594 job ads | Change (percentage points): +7.1 pp |
| Western Australia | October 2025: 13.2% 98 of 744 job ads | October 2026: 19.2% 176 of 919 job ads | Change (percentage points): +6.0 pp |
| Australian Capital Territory | October 2025: 8.8% 52 of 592 job ads | October 2026: 14.1% 146 of 1,036 job ads | Change (percentage points): +5.3 pp |
| South Australia | October 2025: 10.1% 44 of 437 job ads | October 2026: 14.1% 80 of 567 job ads | Change (percentage points): +4.0 pp |
| Northern Territory | October 2025: 8.1%* 6 of 74 job ads | October 2026: 7.3%* 7 of 96 job ads | Change (percentage points): Omitted due to a small sample |
| Tasmania | October 2025: 9.1%* 6 of 66 job ads | October 2026: 7.4%* 5 of 68 job ads | Change (percentage points): Omitted due to a small sample |
Change uses unrounded shares.
* Based on a small sample. Use with caution.
Compares full calendar months. Change uses unrounded shares. Ads without recorded skills stay in the base. Small-sample shares stay in the evidence table. Movement requires two unflagged shares.
Citation
AI Jobs Index Australia. State technology comparisons · year-on-year AI share movement. Information Technology and Computer Science; Engineering is separate · separate recorded location boundaries · AI skill share; each dated observation retains its own count of all job ads. Period: 1 October 2026 to 31 October 2026 versus 1 October 2025 to 31 October 2025. Validated refresh 19 November 2026. Accessed 20 November 2026. Data source: Lightcast. Observed postings through 17 November 2026. Source delivery 19 November 2026. Published by Building Tech Teams. https://www.aijobsindex.com.au/locations#state-comparisons
Compares full calendar months. Change is in percentage points.
All-ad base: 592. Without recorded skills: 0.
All-ad base: 1,036. Without recorded skills: 0.
All-ad base: 3,781. Without recorded skills: 11*.
All-ad base: 4,243. Without recorded skills: 12*.
All-ad base: 74. Without recorded skills: 1*.
All-ad base: 96. Without recorded skills: 1*.
All-ad base: 1,519. Without recorded skills: 7*.
All-ad base: 1,594. Without recorded skills: 8*.
All-ad base: 437. Without recorded skills: 5*.
All-ad base: 567. Without recorded skills: 3*.
All-ad base: 66. Without recorded skills: 1*.
All-ad base: 68. Without recorded skills: 1*.
All-ad base: 2,446. Without recorded skills: 16*.
All-ad base: 3,157. Without recorded skills: 7*.
All-ad base: 744. Without recorded skills: 10*.
All-ad base: 919. Without recorded skills: 2*.
03
Click on each city for city-by-city data.
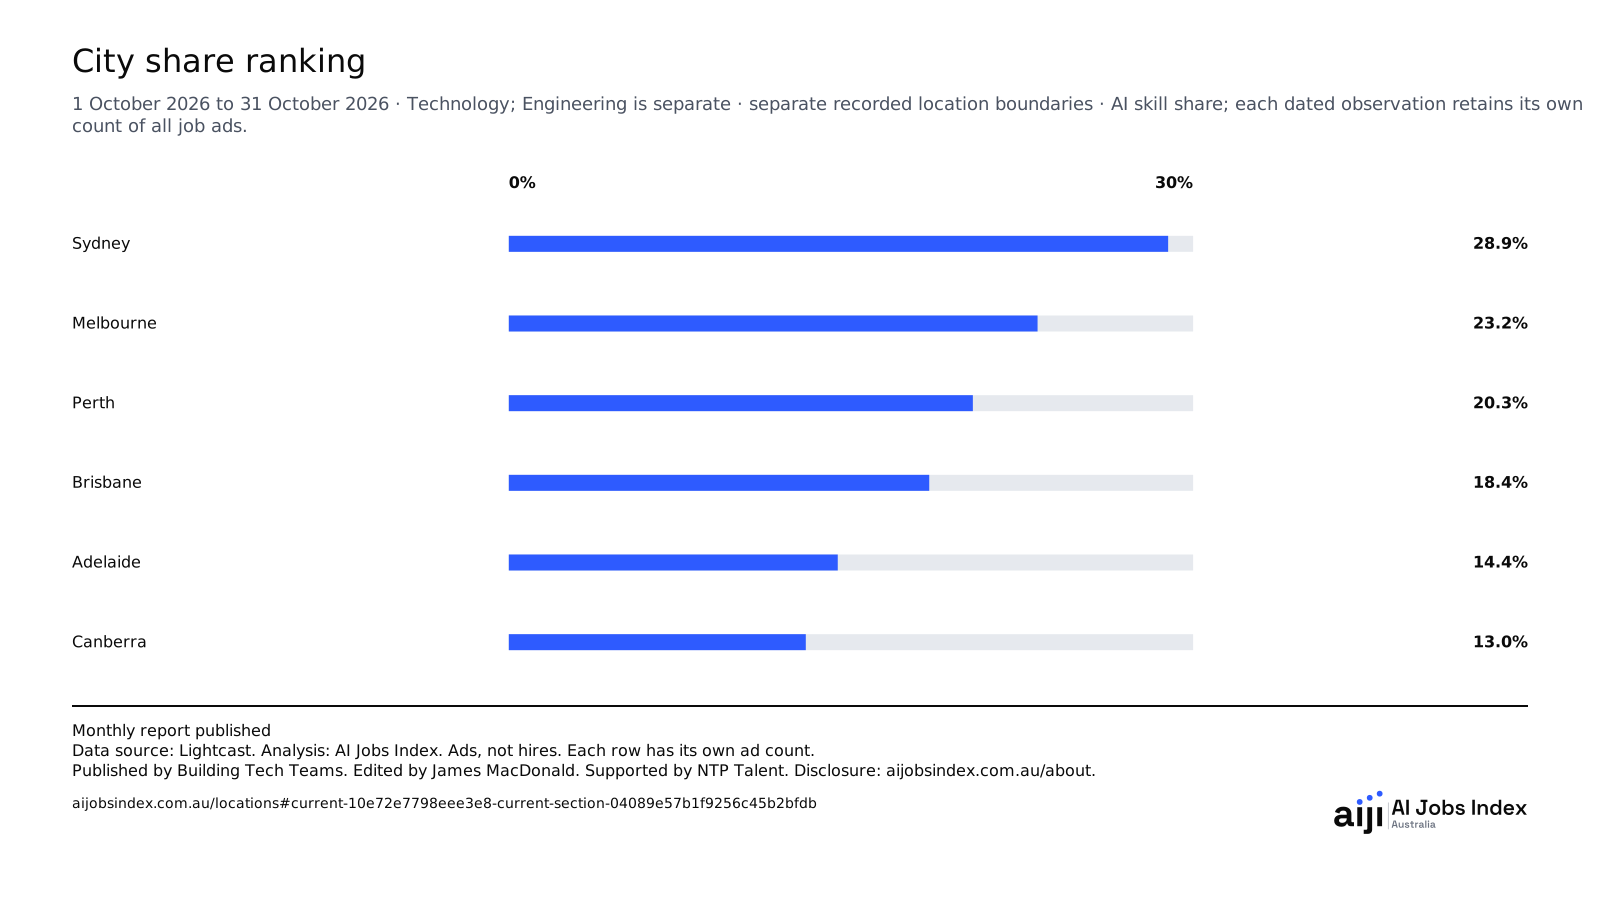
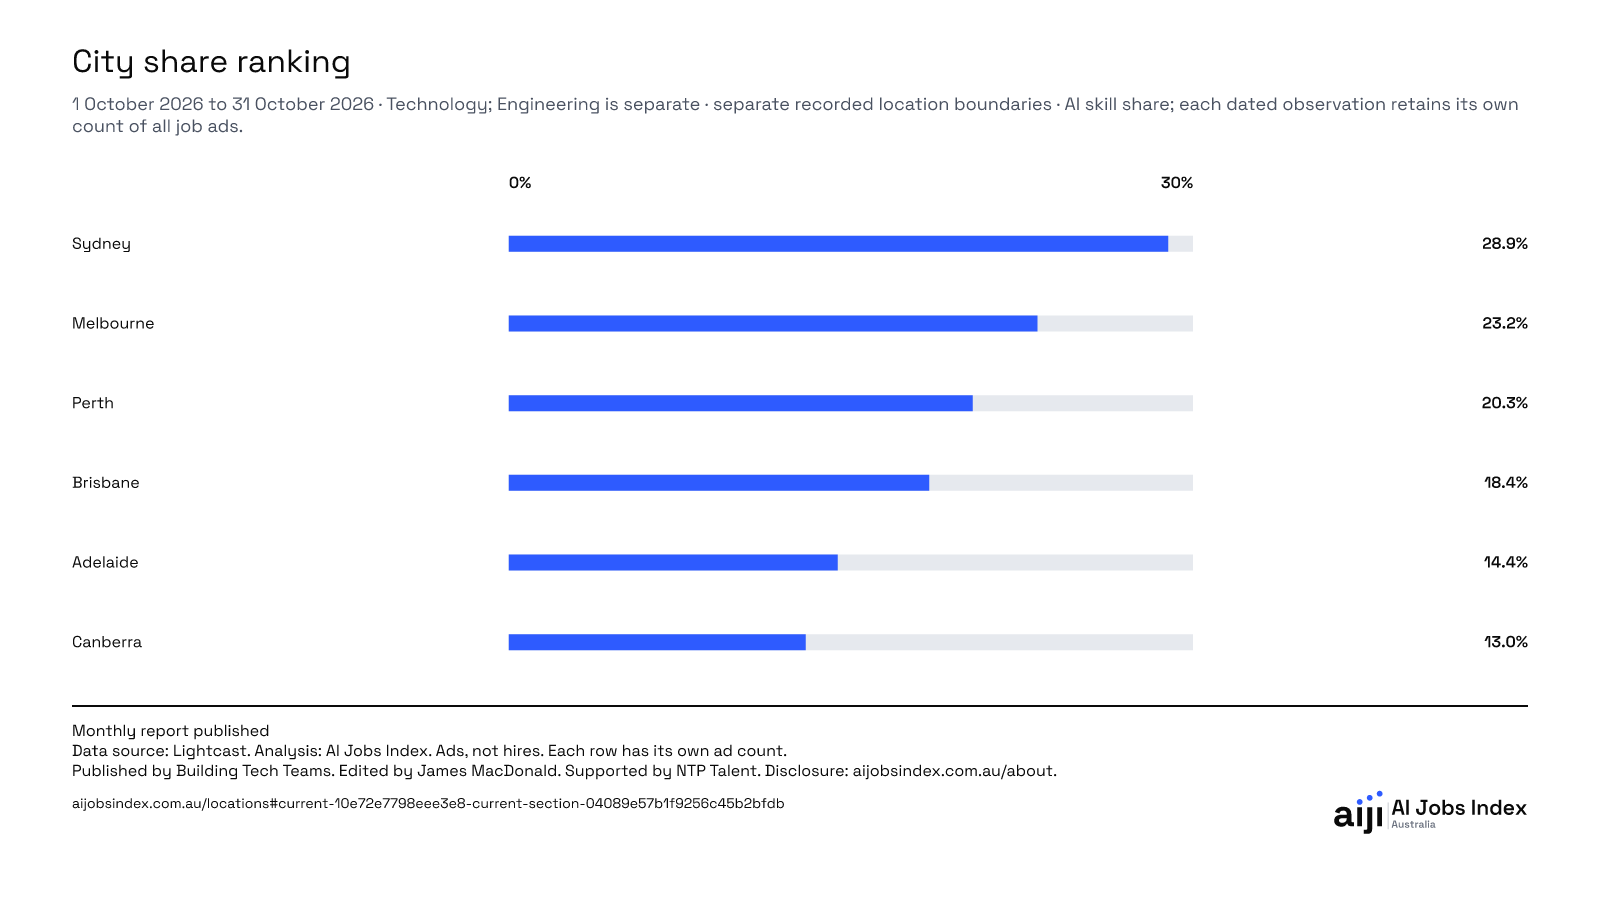
28.9% of technology job ads in Sydney named an AI skill.
Technology job ads. October 2026. Data source: Lightcast.
| Recorded location | AI-tagged ads | All technology ads | AI skill share |
|---|---|---|---|
| Sydney | 1,077 | 3,726 | 28.9% |
| Melbourne | 653 | 2,817 | 23.2% |
| Perth | 142 | 698 | 20.3% |
| Brisbane | 228 | 1,237 | 18.4% |
| Adelaide | 76 | 527 | 14.4% |
| Canberra | 122 | 937 | 13.0% |
Each reading uses the job ads for that group and period.
Citation
AI Jobs Index Australia. City share ranking. Information Technology and Computer Science; Engineering is separate · separate recorded location boundaries · AI skill share; each dated observation retains its own count of all job ads. Period: 1 October 2026 to 31 October 2026. Validated refresh 19 November 2026. Accessed 20 November 2026. Data source: Lightcast. Observed postings through 17 November 2026. Source delivery 19 November 2026. Published by Building Tech Teams. https://www.aijobsindex.com.au/locations#current-10e72e7798eee3e8-current-section-04089e57b1f9256c45b2bfdb
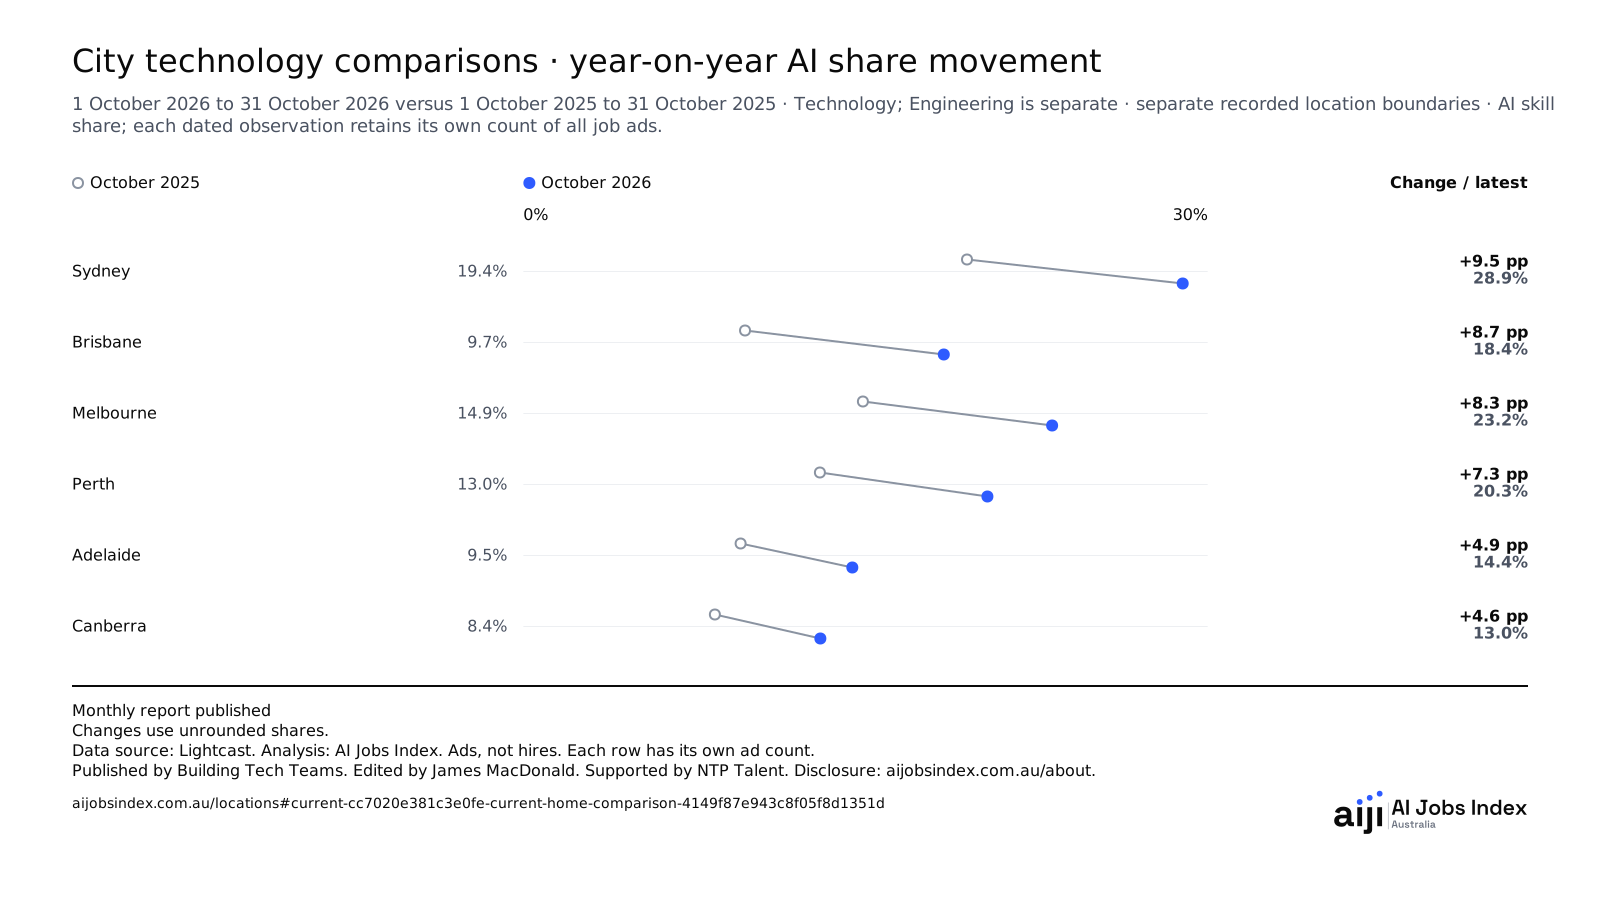
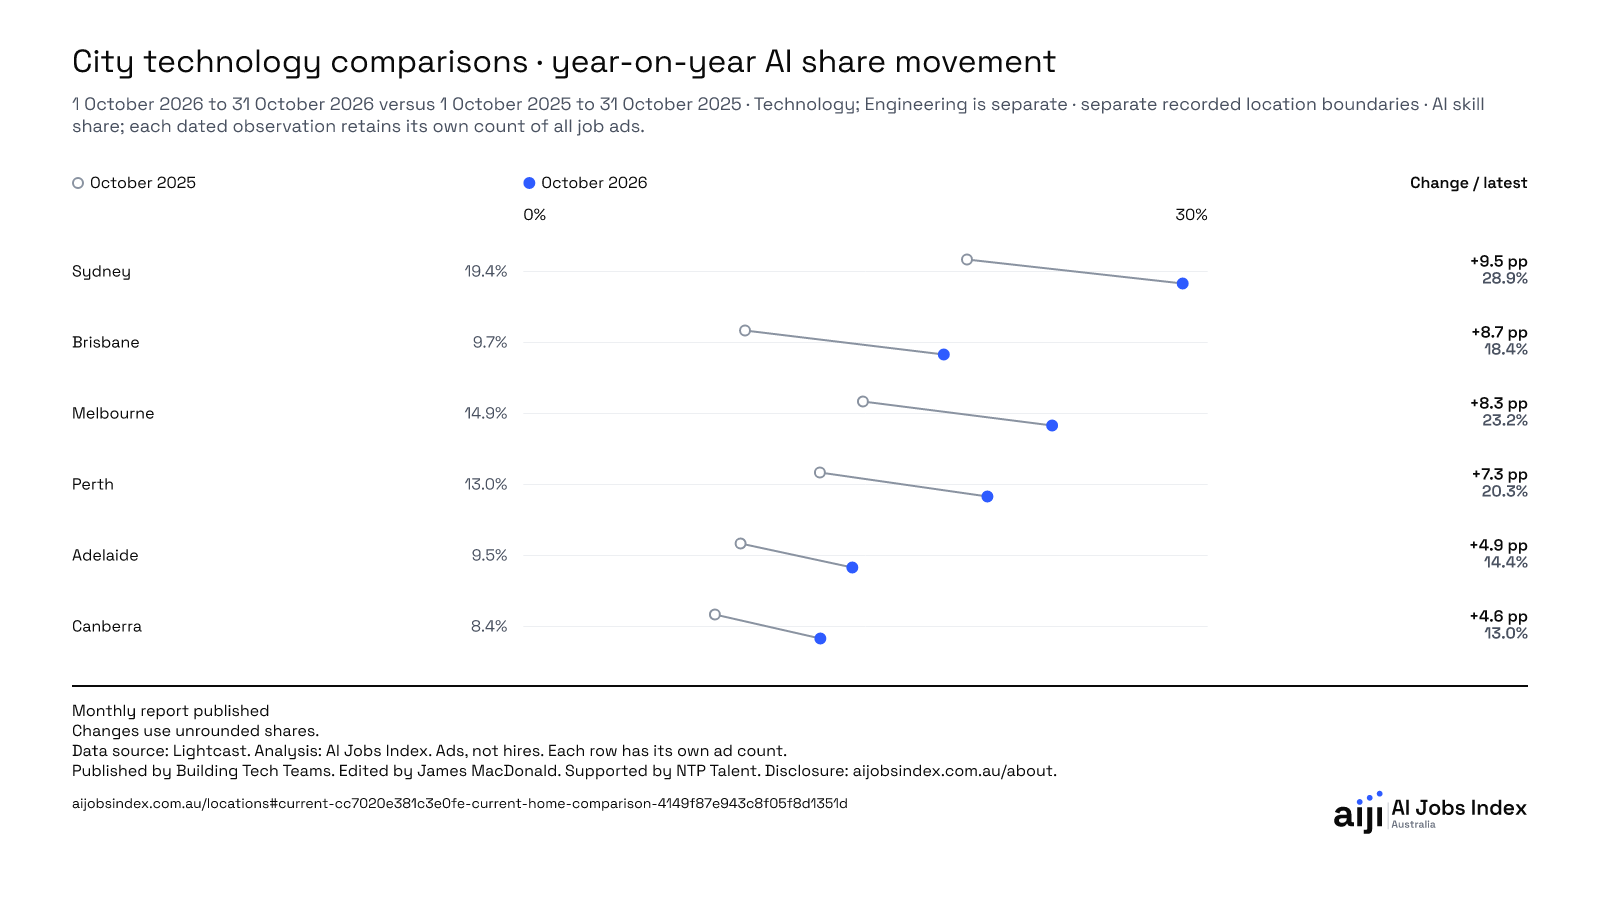
For Sydney, the share rose from 19.4% to 28.9% (+9.5 percentage points).
Technology job ads. October 2026 versus October 2025. Data source: Lightcast.
Change uses unrounded shares.
Darwin and Hobart fall outside the six-city extract. See Data and citation for the monthly readings.
| Location | October 2025 | October 2026 | Change (percentage points) |
|---|---|---|---|
| Sydney | October 2025: 19.4% 635 of 3,265 job ads | October 2026: 28.9% 1,077 of 3,726 job ads | Change (percentage points): +9.5 pp |
| Brisbane | October 2025: 9.7% 117 of 1,204 job ads | October 2026: 18.4% 228 of 1,237 job ads | Change (percentage points): +8.7 pp |
| Melbourne | October 2025: 14.9% 330 of 2,217 job ads | October 2026: 23.2% 653 of 2,817 job ads | Change (percentage points): +8.3 pp |
| Perth | October 2025: 13.0% 78 of 600 job ads | October 2026: 20.3% 142 of 698 job ads | Change (percentage points): +7.3 pp |
| Adelaide | October 2025: 9.5% 38 of 399 job ads | October 2026: 14.4% 76 of 527 job ads | Change (percentage points): +4.9 pp |
| Canberra | October 2025: 8.4% 45 of 536 job ads | October 2026: 13.0% 122 of 937 job ads | Change (percentage points): +4.6 pp |
Change uses unrounded shares.
Compares full calendar months. Change uses unrounded shares. Ads without recorded skills stay in the base. Small-sample shares stay in the evidence table. Movement requires two unflagged shares.
Citation
AI Jobs Index Australia. City technology comparisons · year-on-year AI share movement. Information Technology and Computer Science; Engineering is separate · separate recorded location boundaries · AI skill share; each dated observation retains its own count of all job ads. Period: 1 October 2026 to 31 October 2026 versus 1 October 2025 to 31 October 2025. Validated refresh 19 November 2026. Accessed 20 November 2026. Data source: Lightcast. Observed postings through 17 November 2026. Source delivery 19 November 2026. Published by Building Tech Teams. https://www.aijobsindex.com.au/locations#current-cc7020e381c3e0fe-current-home-comparison-4149f87e943c8f05f8d1351d
Each chart is available as an SVG and a PNG. The images include the period, group of ads and data source.