
Updated 19 November 2026 · Lightcast · Latest figures
Publication timing and context
Monthly report published · Validated refresh 19 November 2026
These figures use the latest validated refresh. The official monthly reports keep their figures as published.
Observed postings through 17 November 2026. Source completeness is unconfirmed. Daily website refresh is separate from monthly editorial publication.
AI Jobs Index Australia
Beyond technology
Full-month year-on-year career-area change
+6.1 ppMarketing and Public Relations
October 2026 · Data source: Lightcast
Marketing and Public Relations: +6.1 pp from October 2025 to October 2026.
Get the monthly release by email
17 of 24 named career areas have an eligible October 2026 reading. 6 career areas are shown in history. Technology is a separately measured reference, not a pooled career-area total.
01
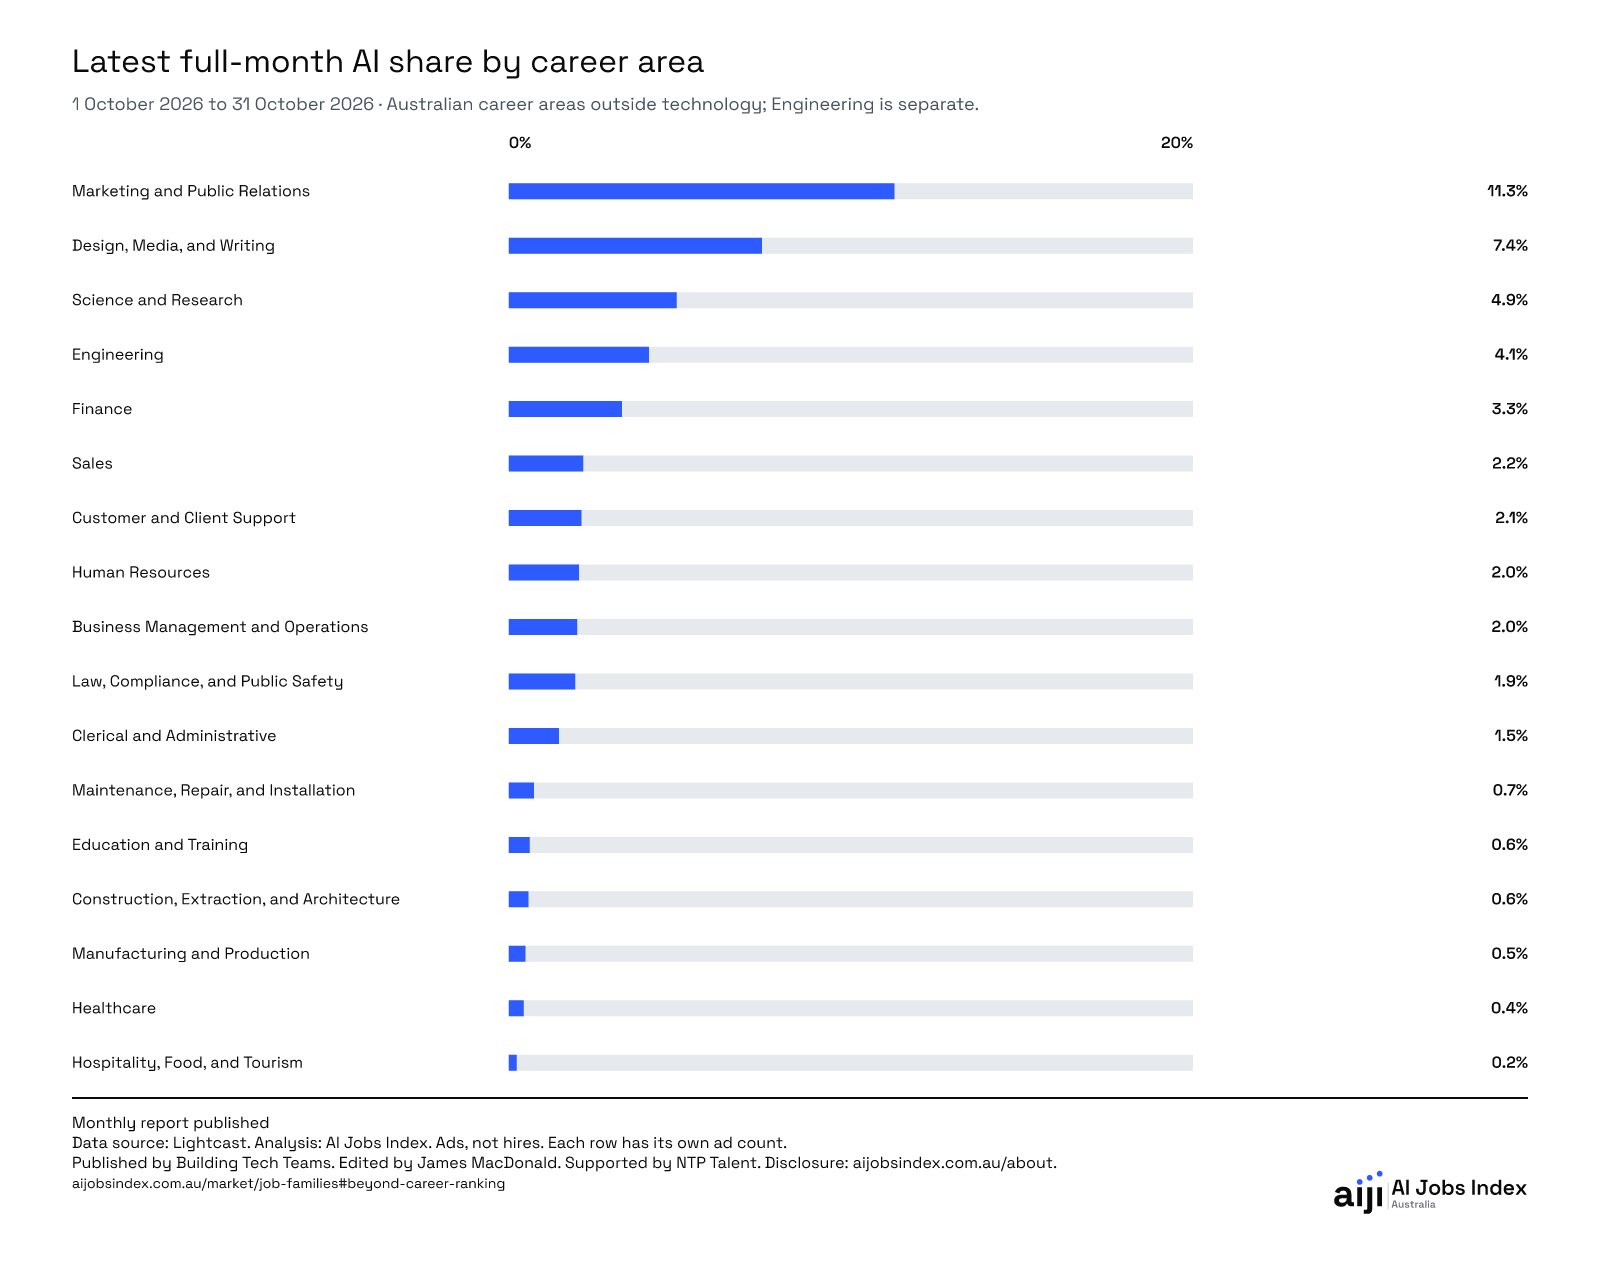
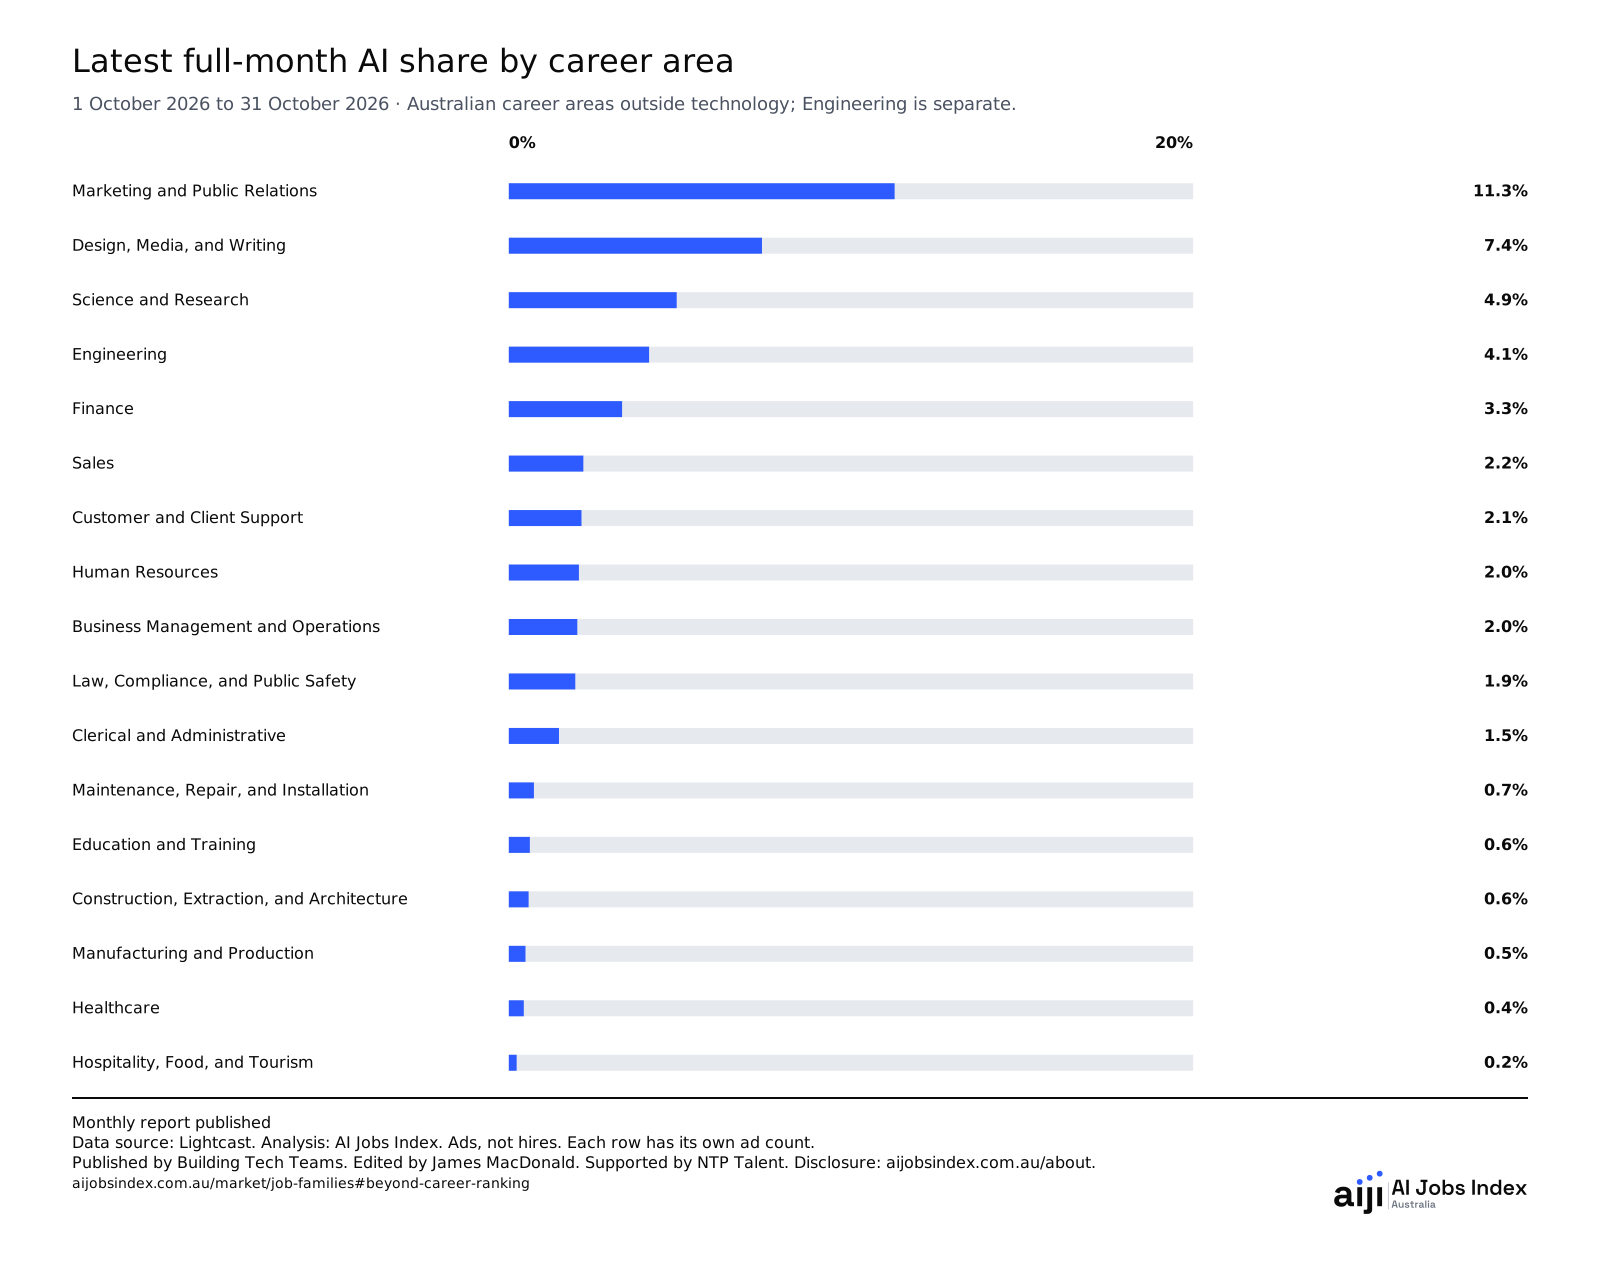
Latest full-month AI share by career area
11.3% of Marketing and Public Relations ads named an AI skill
October 2026. Data source: Lightcast.
- Marketing and Public Relations11.3%
- Design, Media, and Writing7.4%
- Science and Research4.9%
- Engineering4.1%
- Finance3.3%
- Sales2.2%
- Customer and Client Support2.1%
- Human Resources2.0%
- Business Management and Operations2.0%
- Law, Compliance, and Public Safety1.9%
- Clerical and Administrative1.5%
- Maintenance, Repair, and Installation0.7%
- Education and Training0.6%
- Construction, Extraction, and Architecture0.6%
- Manufacturing and Production0.5%
- Healthcare0.4%
- Hospitality, Food, and Tourism0.2%
Data and citation
| Entry | Reading and base |
|---|---|
| Marketing and Public Relations | 11.3% October 2026 · 486 AI-tagged / 4,310 all ads |
| Design, Media, and Writing | 7.4% October 2026 · 132 AI-tagged / 1,784 all ads |
| Science and Research | 4.9% October 2026 · 92 AI-tagged / 1,875 all ads |
| Engineering | 4.1% October 2026 · 297 AI-tagged / 7,244 all ads |
| Finance | 3.3% October 2026 · 414 AI-tagged / 12,504 all ads |
| Sales | 2.2% October 2026 · 486 AI-tagged / 22,307 all ads |
| Customer and Client Support | 2.1% October 2026 · 104 AI-tagged / 4,896 all ads |
| Human Resources | 2.0% October 2026 · 95 AI-tagged / 4,637 all ads |
| Business Management and Operations | 2.0% October 2026 · 524 AI-tagged / 26,178 all ads |
| Law, Compliance, and Public Safety | 1.9% October 2026 · 131 AI-tagged / 6,742 all ads |
| Clerical and Administrative | 1.5% October 2026 · 99 AI-tagged / 6,750 all ads |
| Maintenance, Repair, and Installation | 0.7% October 2026 · 70 AI-tagged / 9,536 all ads |
| Education and Training | 0.6% October 2026 · 82 AI-tagged / 13,332 all ads |
| Construction, Extraction, and Architecture | 0.6% October 2026 · 78 AI-tagged / 13,475 all ads |
| Manufacturing and Production | 0.5% October 2026 · 32 AI-tagged / 6,561 all ads |
| Healthcare | 0.4% October 2026 · 132 AI-tagged / 30,126 all ads |
| Hospitality, Food, and Tourism | 0.2% October 2026 · 49 AI-tagged / 21,369 all ads |
- Population
- Australian career areas outside technology; Engineering is separate.
- Chart dates
- 1 October 2026 to 31 October 2026
- Latest posting date in the source
- 17 November 2026
- Data source
- Lightcast
- Ads counted
- Each row has its own ad count. They are not added together.
- Coverage
- Observed postings through 17 November 2026. Source completeness is unconfirmed. Daily website refresh is separate from monthly editorial publication.
- Unrecorded information
- Each population has its own number of ads counted. Advertisements without recorded skills remain in the base.
Each percentage uses all ads in the same career area and full calendar month. Missing and flagged cells are not ranked.
| Entry | Reading and base |
|---|---|
| Agriculture, Horticulture, & the Outdoors | 0.3%* October 2026 · 11* AI-tagged / 3,287 all ads |
| Community and Social Services | 0.2%* October 2026 · 13* AI-tagged / 7,251 all ads |
| Military | 1.2%* October 2026 · 2* AI-tagged / 172 all ads |
| Performing Arts | 2.9%* October 2026 · 5* AI-tagged / 173 all ads |
| Personal Services | 0.2%* October 2026 · 3* AI-tagged / 1,996 all ads |
| Social Analysis and Planning | 1.8%* October 2026 · 17* AI-tagged / 950 all ads |
| Transportation | 0.2%* October 2026 · 9* AI-tagged / 5,914 all ads |
* Based on a small sample. Use with caution.
Missing, protected and small-sample observations are disclosed here, not ranked.
Citation
AI Jobs Index Australia. Latest full-month AI share by career area. Australian career areas outside technology; Engineering is separate. Period: 1 October 2026 to 31 October 2026. Validated refresh 19 November 2026. Accessed 20 November 2026. Data source: Lightcast. Observed postings through 17 November 2026. Source delivery 19 November 2026. Published by Building Tech Teams. https://www.aijobsindex.com.au/market/job-families#beyond-career-ranking
02
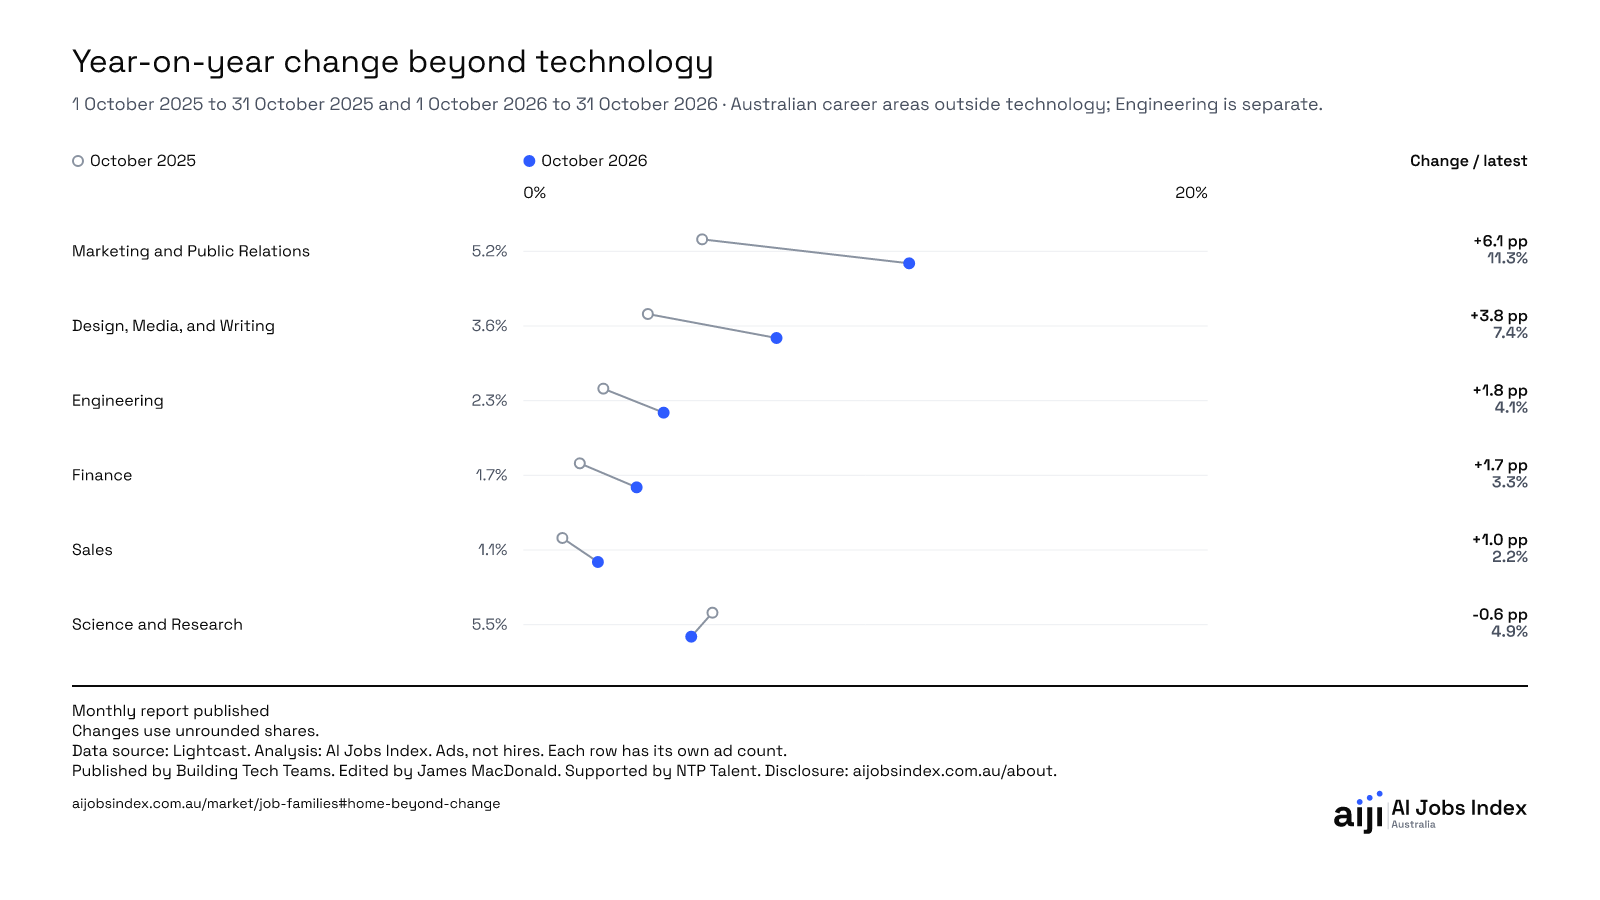
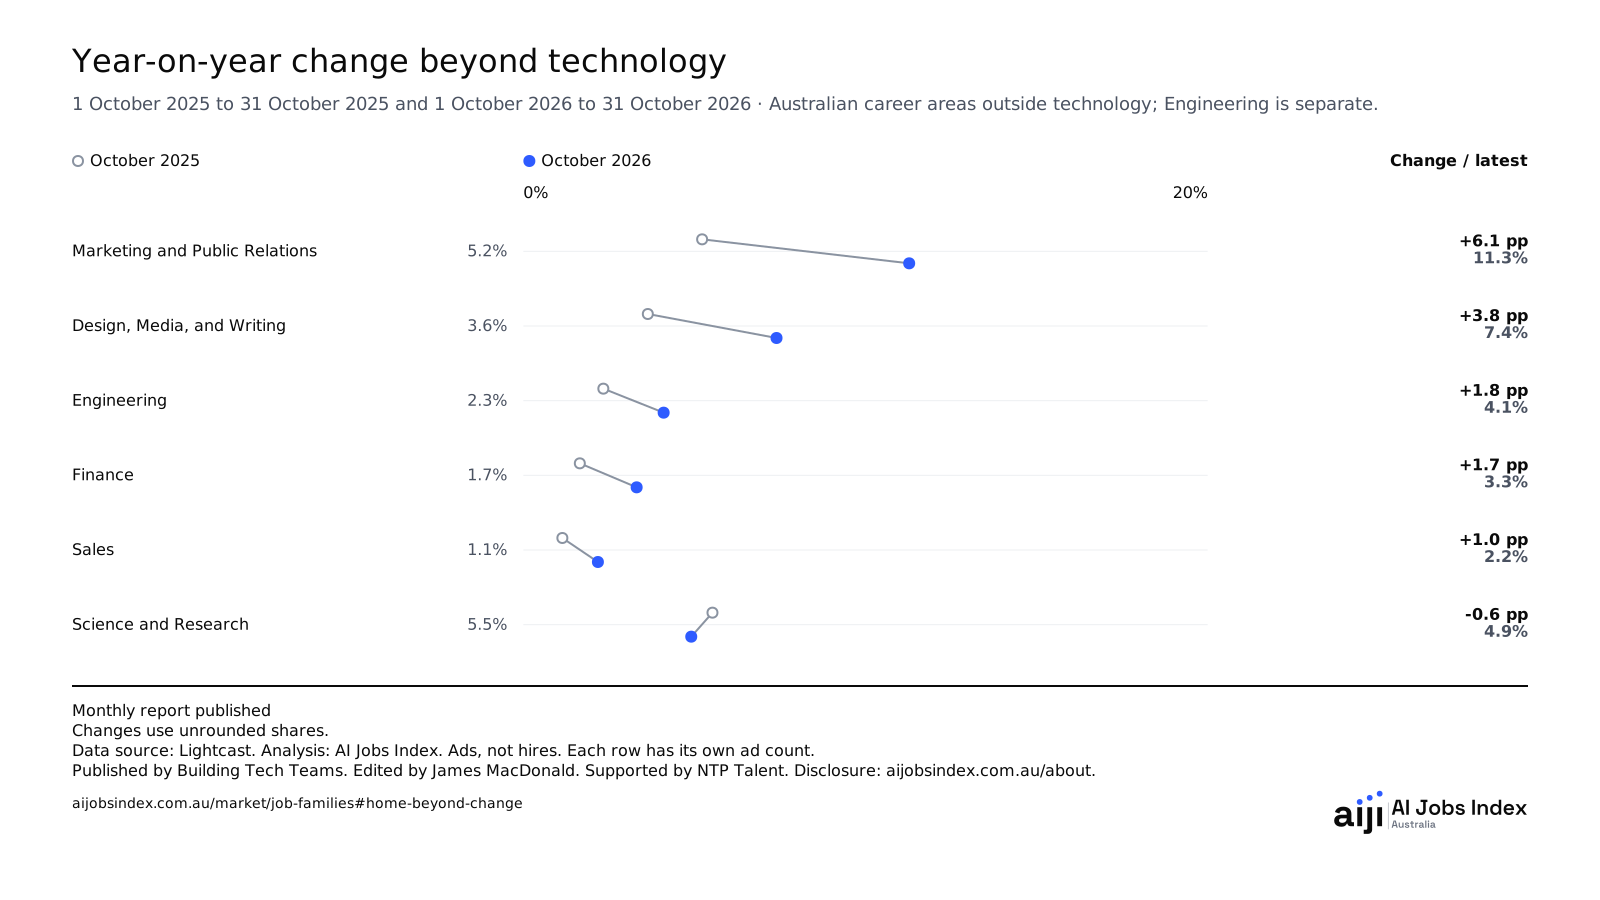
Full-month year-on-year change
Marketing and Public Relations: +6.1 pp from October 2025 to October 2026.
October 2025 and October 2026. Data source: Lightcast.
- Marketing and Public Relations+6.1 percentage points+6.1 pp11.3%
- Design, Media, and Writing+3.8 percentage points+3.8 pp7.4%
- Engineering+1.8 percentage points+1.8 pp4.1%
- Finance+1.7 percentage points+1.7 pp3.3%
- Sales+1.0 percentage points+1.0 pp2.2%
- Science and Research-0.6 percentage points-0.6 pp4.9%
Change uses unrounded shares.
Data and citation
| Requirement or population | October 2025 | October 2026 | Change (percentage points) |
|---|---|---|---|
| Marketing and Public Relations | October 2025: 5.2% October 2025 · 220 AI-tagged / 4,211 all ads | October 2026: 11.3% October 2026 · 486 AI-tagged / 4,310 all ads | Change (percentage points): +6.1 pp |
| Design, Media, and Writing | October 2025: 3.6% October 2025 · 61 AI-tagged / 1,677 all ads | October 2026: 7.4% October 2026 · 132 AI-tagged / 1,784 all ads | Change (percentage points): +3.8 pp |
| Engineering | October 2025: 2.3% October 2025 · 129 AI-tagged / 5,519 all ads | October 2026: 4.1% October 2026 · 297 AI-tagged / 7,244 all ads | Change (percentage points): +1.8 pp |
| Finance | October 2025: 1.7% October 2025 · 203 AI-tagged / 12,302 all ads | October 2026: 3.3% October 2026 · 414 AI-tagged / 12,504 all ads | Change (percentage points): +1.7 pp |
| Sales | October 2025: 1.1% October 2025 · 228 AI-tagged / 20,002 all ads | October 2026: 2.2% October 2026 · 486 AI-tagged / 22,307 all ads | Change (percentage points): +1.0 pp |
| Science and Research | October 2025: 5.5% October 2025 · 96 AI-tagged / 1,737 all ads | October 2026: 4.9% October 2026 · 92 AI-tagged / 1,875 all ads | Change (percentage points): -0.6 pp |
Change uses unrounded shares.
- Population
- Australian career areas outside technology; Engineering is separate.
- Chart dates
- 1 October 2025 to 31 October 2025 and 1 October 2026 to 31 October 2026
- Latest posting date in the source
- 17 November 2026
- Data source
- Lightcast
- Ads counted
- Each row has its own ad count. They are not added together.
- Coverage
- Observed postings through 17 November 2026. Source completeness is unconfirmed. Daily website refresh is separate from monthly editorial publication.
- Unrecorded information
- Each population has its own number of ads counted. Advertisements without recorded skills remain in the base.
Matching full calendar months one year apart, using unrounded shares. Differences are percentage points, not percentage volume growth. Both readings must be eligible.
Citation
AI Jobs Index Australia. Year-on-year change beyond technology. Australian career areas outside technology; Engineering is separate. Period: 1 October 2025 to 31 October 2025 and 1 October 2026 to 31 October 2026. Validated refresh 19 November 2026. Accessed 20 November 2026. Data source: Lightcast. Observed postings through 17 November 2026. Source delivery 19 November 2026. Published by Building Tech Teams. https://www.aijobsindex.com.au/market/job-families#home-beyond-change
03
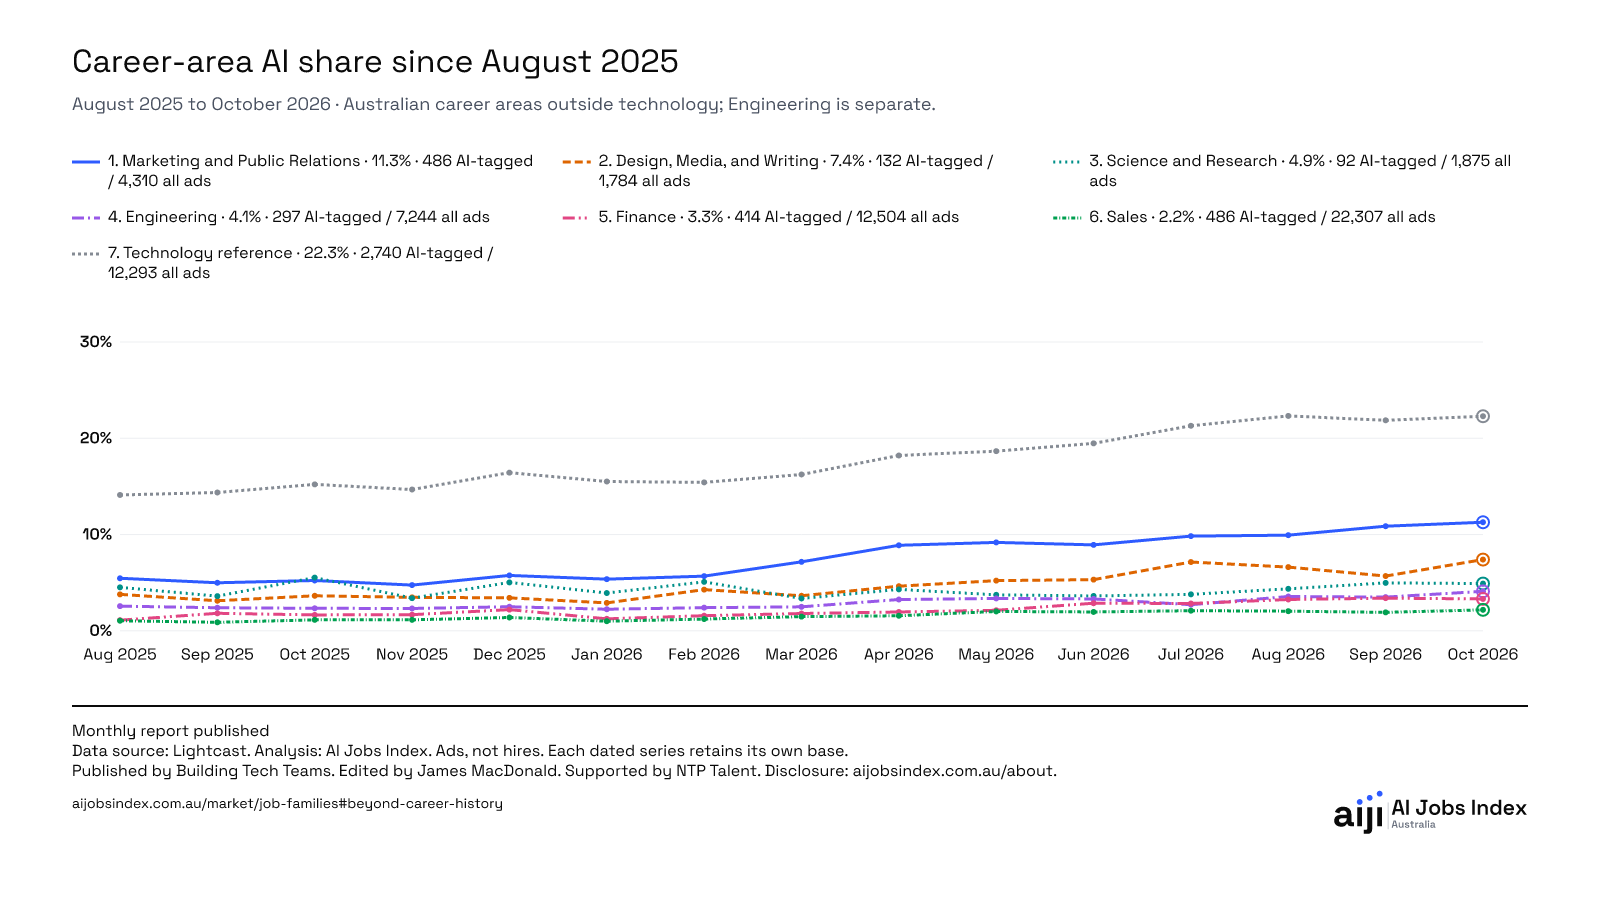
Career-area history since August 2025
17 of 24 named career areas have an eligible October 2026 reading. 6 career areas are shown in history. Technology is a separately measured reference, not a pooled career-area total.
August 2025 to October 2026. Data source: Lightcast.
Data and citation
| Entry | Reading and base |
|---|---|
| August 2025 | Marketing and Public Relations · 5.5% August 2025 · 238 AI-tagged / 4,361 all ads |
| September 2025 | Marketing and Public Relations · 5.0% September 2025 · 222 AI-tagged / 4,450 all ads |
| October 2025 | Marketing and Public Relations · 5.2% October 2025 · 220 AI-tagged / 4,211 all ads |
| November 2025 | Marketing and Public Relations · 4.7% November 2025 · 183 AI-tagged / 3,854 all ads |
| December 2025 | Marketing and Public Relations · 5.8% December 2025 · 168 AI-tagged / 2,921 all ads |
| January 2026 | Marketing and Public Relations · 5.4% January 2026 · 234 AI-tagged / 4,362 all ads |
| February 2026 | Marketing and Public Relations · 5.7% February 2026 · 267 AI-tagged / 4,703 all ads |
| March 2026 | Marketing and Public Relations · 7.2% March 2026 · 331 AI-tagged / 4,621 all ads |
| April 2026 | Marketing and Public Relations · 8.9% April 2026 · 371 AI-tagged / 4,177 all ads |
| May 2026 | Marketing and Public Relations · 9.2% May 2026 · 385 AI-tagged / 4,193 all ads |
| June 2026 | Marketing and Public Relations · 8.9% June 2026 · 406 AI-tagged / 4,549 all ads |
| July 2026 | Marketing and Public Relations · 9.8% July 2026 · 448 AI-tagged / 4,555 all ads |
| August 2026 | Marketing and Public Relations · 9.9% August 2026 · 462 AI-tagged / 4,651 all ads |
| September 2026 | Marketing and Public Relations · 10.9% September 2026 · 446 AI-tagged / 4,105 all ads |
| October 2026 | Marketing and Public Relations · 11.3% October 2026 · 486 AI-tagged / 4,310 all ads |
| August 2025 | Design, Media, and Writing · 3.8% August 2025 · 65 AI-tagged / 1,717 all ads |
| September 2025 | Design, Media, and Writing · 3.1% September 2025 · 56 AI-tagged / 1,795 all ads |
| October 2025 | Design, Media, and Writing · 3.6% October 2025 · 61 AI-tagged / 1,677 all ads |
| November 2025 | Design, Media, and Writing · 3.5% November 2025 · 54 AI-tagged / 1,554 all ads |
| December 2025 | Design, Media, and Writing · 3.4% December 2025 · 43 AI-tagged / 1,257 all ads |
| January 2026 | Design, Media, and Writing · 2.9% January 2026 · 52 AI-tagged / 1,794 all ads |
| February 2026 | Design, Media, and Writing · 4.3% February 2026 · 84 AI-tagged / 1,964 all ads |
| March 2026 | Design, Media, and Writing · 3.6% March 2026 · 72 AI-tagged / 1,978 all ads |
| April 2026 | Design, Media, and Writing · 4.6% April 2026 · 78 AI-tagged / 1,683 all ads |
| May 2026 | Design, Media, and Writing · 5.2% May 2026 · 94 AI-tagged / 1,804 all ads |
| June 2026 | Design, Media, and Writing · 5.3% June 2026 · 103 AI-tagged / 1,938 all ads |
| July 2026 | Design, Media, and Writing · 7.1% July 2026 · 134 AI-tagged / 1,876 all ads |
| August 2026 | Design, Media, and Writing · 6.6% August 2026 · 134 AI-tagged / 2,025 all ads |
| September 2026 | Design, Media, and Writing · 5.7% September 2026 · 98 AI-tagged / 1,723 all ads |
| October 2026 | Design, Media, and Writing · 7.4% October 2026 · 132 AI-tagged / 1,784 all ads |
| August 2025 | Science and Research · 4.5% August 2025 · 86 AI-tagged / 1,905 all ads |
| September 2025 | Science and Research · 3.6% September 2025 · 64 AI-tagged / 1,777 all ads |
| October 2025 | Science and Research · 5.5% October 2025 · 96 AI-tagged / 1,737 all ads |
| November 2025 | Science and Research · 3.4% November 2025 · 59 AI-tagged / 1,739 all ads |
| December 2025 | Science and Research · 5.0% December 2025 · 70 AI-tagged / 1,393 all ads |
| January 2026 | Science and Research · 3.9% January 2026 · 66 AI-tagged / 1,682 all ads |
| February 2026 | Science and Research · 5.1% February 2026 · 102 AI-tagged / 2,007 all ads |
| March 2026 | Science and Research · 3.4% March 2026 · 71 AI-tagged / 2,115 all ads |
| April 2026 | Science and Research · 4.3% April 2026 · 80 AI-tagged / 1,860 all ads |
| May 2026 | Science and Research · 3.7% May 2026 · 74 AI-tagged / 1,981 all ads |
| June 2026 | Science and Research · 3.6% June 2026 · 73 AI-tagged / 2,017 all ads |
| July 2026 | Science and Research · 3.8% July 2026 · 70 AI-tagged / 1,848 all ads |
| August 2026 | Science and Research · 4.4% August 2026 · 86 AI-tagged / 1,973 all ads |
| September 2026 | Science and Research · 5.0% September 2026 · 89 AI-tagged / 1,789 all ads |
| October 2026 | Science and Research · 4.9% October 2026 · 92 AI-tagged / 1,875 all ads |
| August 2025 | Engineering · 2.6% August 2025 · 141 AI-tagged / 5,504 all ads |
| September 2025 | Engineering · 2.4% September 2025 · 136 AI-tagged / 5,680 all ads |
| October 2025 | Engineering · 2.3% October 2025 · 129 AI-tagged / 5,519 all ads |
| November 2025 | Engineering · 2.3% November 2025 · 122 AI-tagged / 5,263 all ads |
| December 2025 | Engineering · 2.5% December 2025 · 102 AI-tagged / 4,080 all ads |
| January 2026 | Engineering · 2.2% January 2026 · 127 AI-tagged / 5,671 all ads |
| February 2026 | Engineering · 2.4% February 2026 · 155 AI-tagged / 6,447 all ads |
| March 2026 | Engineering · 2.5% March 2026 · 179 AI-tagged / 7,190 all ads |
| April 2026 | Engineering · 3.2% April 2026 · 203 AI-tagged / 6,248 all ads |
| May 2026 | Engineering · 3.4% May 2026 · 229 AI-tagged / 6,812 all ads |
| June 2026 | Engineering · 3.3% June 2026 · 220 AI-tagged / 6,644 all ads |
| July 2026 | Engineering · 2.7% July 2026 · 194 AI-tagged / 7,152 all ads |
| August 2026 | Engineering · 3.6% August 2026 · 261 AI-tagged / 7,325 all ads |
| September 2026 | Engineering · 3.5% September 2026 · 231 AI-tagged / 6,601 all ads |
| October 2026 | Engineering · 4.1% October 2026 · 297 AI-tagged / 7,244 all ads |
| August 2025 | Finance · 1.1% August 2025 · 129 AI-tagged / 11,700 all ads |
| September 2025 | Finance · 1.8% September 2025 · 222 AI-tagged / 12,205 all ads |
| October 2025 | Finance · 1.7% October 2025 · 203 AI-tagged / 12,302 all ads |
| November 2025 | Finance · 1.7% November 2025 · 185 AI-tagged / 11,047 all ads |
| December 2025 | Finance · 2.2% December 2025 · 189 AI-tagged / 8,590 all ads |
| January 2026 | Finance · 1.2% January 2026 · 165 AI-tagged / 13,282 all ads |
| February 2026 | Finance · 1.6% February 2026 · 221 AI-tagged / 14,089 all ads |
| March 2026 | Finance · 1.8% March 2026 · 249 AI-tagged / 13,865 all ads |
| April 2026 | Finance · 2.0% April 2026 · 277 AI-tagged / 14,174 all ads |
| May 2026 | Finance · 2.1% May 2026 · 274 AI-tagged / 12,869 all ads |
| June 2026 | Finance · 2.9% June 2026 · 358 AI-tagged / 12,496 all ads |
| July 2026 | Finance · 2.8% July 2026 · 358 AI-tagged / 12,618 all ads |
| August 2026 | Finance · 3.3% August 2026 · 424 AI-tagged / 13,036 all ads |
| September 2026 | Finance · 3.4% September 2026 · 395 AI-tagged / 11,646 all ads |
| October 2026 | Finance · 3.3% October 2026 · 414 AI-tagged / 12,504 all ads |
| August 2025 | Sales · 1.0% August 2025 · 207 AI-tagged / 19,799 all ads |
| September 2025 | Sales · 0.9% September 2025 · 193 AI-tagged / 21,899 all ads |
| October 2025 | Sales · 1.1% October 2025 · 228 AI-tagged / 20,002 all ads |
| November 2025 | Sales · 1.1% November 2025 · 186 AI-tagged / 16,319 all ads |
| December 2025 | Sales · 1.4% December 2025 · 167 AI-tagged / 12,083 all ads |
| January 2026 | Sales · 1.0% January 2026 · 227 AI-tagged / 22,778 all ads |
| February 2026 | Sales · 1.2% February 2026 · 256 AI-tagged / 20,989 all ads |
| March 2026 | Sales · 1.5% March 2026 · 290 AI-tagged / 19,717 all ads |
| April 2026 | Sales · 1.6% April 2026 · 298 AI-tagged / 19,063 all ads |
| May 2026 | Sales · 2.0% May 2026 · 356 AI-tagged / 17,710 all ads |
| June 2026 | Sales · 2.0% June 2026 · 359 AI-tagged / 18,331 all ads |
| July 2026 | Sales · 2.1% July 2026 · 413 AI-tagged / 19,778 all ads |
| August 2026 | Sales · 2.0% August 2026 · 448 AI-tagged / 21,961 all ads |
| September 2026 | Sales · 1.9% September 2026 · 422 AI-tagged / 22,044 all ads |
| October 2026 | Sales · 2.2% October 2026 · 486 AI-tagged / 22,307 all ads |
| August 2025 | Technology reference · 14.1% August 2025 · 1,424 AI-tagged / 10,093 all ads |
| September 2025 | Technology reference · 14.4% September 2025 · 1,459 AI-tagged / 10,156 all ads |
| October 2025 | Technology reference · 15.2% October 2025 · 1,573 AI-tagged / 10,342 all ads |
| November 2025 | Technology reference · 14.7% November 2025 · 1,415 AI-tagged / 9,642 all ads |
| December 2025 | Technology reference · 16.4% December 2025 · 1,184 AI-tagged / 7,207 all ads |
| January 2026 | Technology reference · 15.5% January 2026 · 1,504 AI-tagged / 9,698 all ads |
| February 2026 | Technology reference · 15.4% February 2026 · 1,692 AI-tagged / 10,975 all ads |
| March 2026 | Technology reference · 16.2% March 2026 · 1,848 AI-tagged / 11,382 all ads |
| April 2026 | Technology reference · 18.2% April 2026 · 2,246 AI-tagged / 12,333 all ads |
| May 2026 | Technology reference · 18.7% May 2026 · 2,042 AI-tagged / 10,942 all ads |
| June 2026 | Technology reference · 19.5% June 2026 · 2,102 AI-tagged / 10,796 all ads |
| July 2026 | Technology reference · 21.3% July 2026 · 2,431 AI-tagged / 11,415 all ads |
| August 2026 | Technology reference · 22.3% August 2026 · 2,640 AI-tagged / 11,828 all ads |
| September 2026 | Technology reference · 21.9% September 2026 · 2,530 AI-tagged / 11,571 all ads |
| October 2026 | Technology reference · 22.3% October 2026 · 2,740 AI-tagged / 12,293 all ads |
- Population
- Australian career areas outside technology; Engineering is separate.
- Chart dates
- August 2025 to October 2026
- Latest posting date in the source
- 17 November 2026
- Data source
- Lightcast
- Ads counted
- Each row has its own ad count. They are not added together.
- Coverage
- Observed postings through 17 November 2026. Source completeness is unconfirmed. Daily website refresh is separate from monthly editorial publication.
- Unrecorded information
- Each population has its own number of ads counted. Advertisements without recorded skills remain in the base.
Top career areas selected by the latest eligible full-month shares, with independently measured technology in grey. One common zero-based percentage scale. Missing months stay gaps and lines never join across them.
Citation
AI Jobs Index Australia. Career-area AI share since August 2025. Australian career areas outside technology; Engineering is separate. Period: August 2025 to October 2026. Validated refresh 19 November 2026. Accessed 20 November 2026. Data source: Lightcast. Observed postings through 17 November 2026. Source delivery 19 November 2026. Published by Building Tech Teams. https://www.aijobsindex.com.au/market/job-families#beyond-career-history
Career areas group related occupations. Each percentage uses all ads in the same area and month. Engineering is separate from technology. Measurement and limitations.