Adelaide · 1–31 August 2025
All-ad base: 409. Without recorded skills: 2*.
Updated 19 November 2026 · Lightcast · Latest figures
Monthly report published · Validated refresh 19 November 2026
These figures use the latest validated refresh. The official monthly reports keep their figures as published.
Observed postings through 17 November 2026. Source completeness is unconfirmed. Daily website refresh is separate from monthly editorial publication.
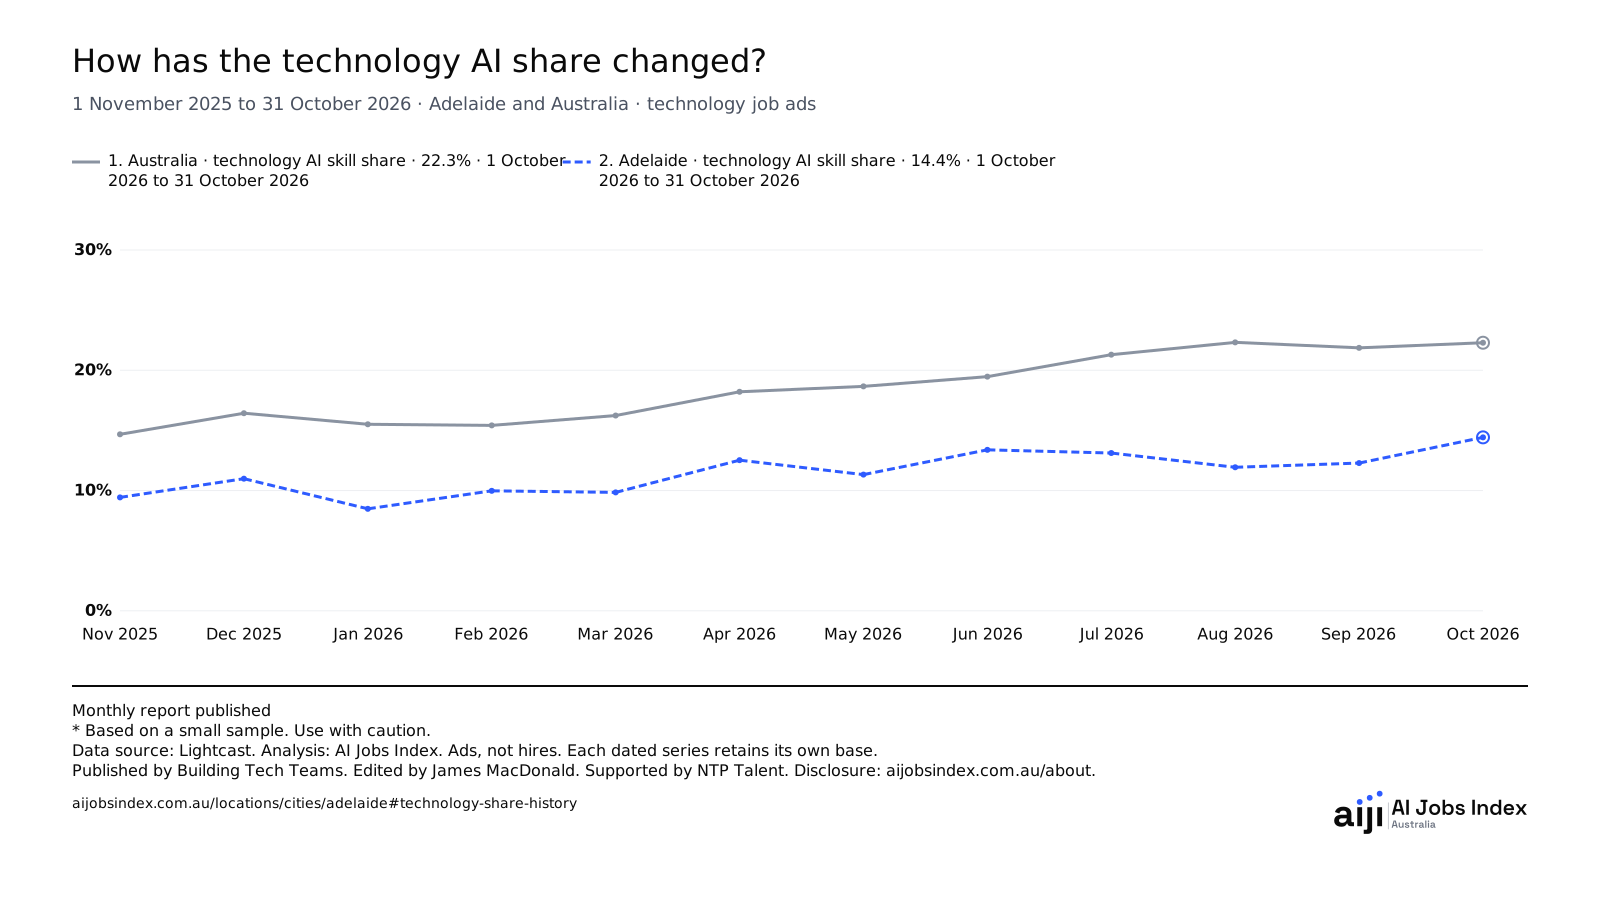
Share of technology job ads naming an AI skill. October 2026. Data source: Lightcast.
Read the supporting evidence →01
02
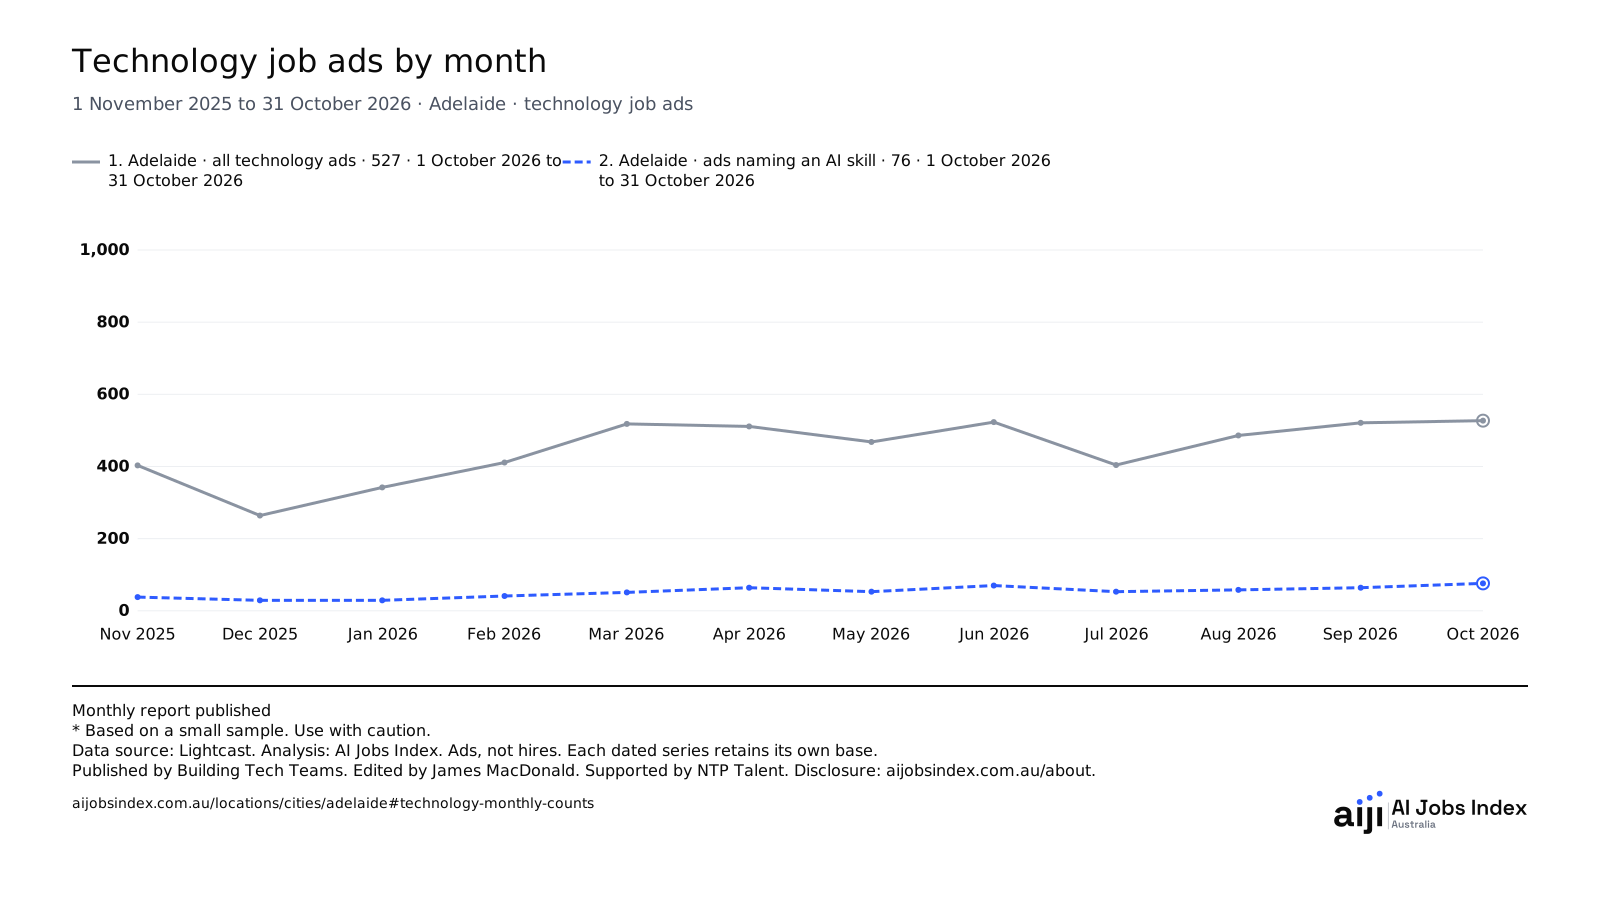
527 technology job ads appeared in Adelaide in October 2026. 76 named an AI skill.
Last 12 months, finishing October 2026. Data source: Lightcast.
| Entry | Reading and base |
|---|---|
| November 2025 | Adelaide · all technology ads · 403 Distinct advertisement count · 1 November 2025 to 30 November 2025 |
| December 2025 | Adelaide · all technology ads · 264 Distinct advertisement count · 1 December 2025 to 31 December 2025 |
| January 2026 | Adelaide · all technology ads · 342 Distinct advertisement count · 1 January 2026 to 31 January 2026 |
| February 2026 | Adelaide · all technology ads · 411 Distinct advertisement count · 1 February 2026 to 28 February 2026 |
| March 2026 | Adelaide · all technology ads · 518 Distinct advertisement count · 1 March 2026 to 31 March 2026 |
| April 2026 | Adelaide · all technology ads · 511 Distinct advertisement count · 1 April 2026 to 30 April 2026 |
| May 2026 | Adelaide · all technology ads · 468 Distinct advertisement count · 1 May 2026 to 31 May 2026 |
| June 2026 | Adelaide · all technology ads · 523 Distinct advertisement count · 1 June 2026 to 30 June 2026 |
| July 2026 | Adelaide · all technology ads · 404 Distinct advertisement count · 1 July 2026 to 31 July 2026 |
| August 2026 | Adelaide · all technology ads · 486 Distinct advertisement count · 1 August 2026 to 31 August 2026 |
| September 2026 | Adelaide · all technology ads · 521 Distinct advertisement count · 1 September 2026 to 30 September 2026 |
| October 2026 | Adelaide · all technology ads · 527 Distinct advertisement count · 1 October 2026 to 31 October 2026 |
| November 2025 | Adelaide · ads naming an AI skill · 38 Distinct advertisement count · 1 November 2025 to 30 November 2025 |
| December 2025 | Adelaide · ads naming an AI skill · 29* Distinct advertisement count · 1 December 2025 to 31 December 2025 |
| January 2026 | Adelaide · ads naming an AI skill · 29* Distinct advertisement count · 1 January 2026 to 31 January 2026 |
| February 2026 | Adelaide · ads naming an AI skill · 41 Distinct advertisement count · 1 February 2026 to 28 February 2026 |
| March 2026 | Adelaide · ads naming an AI skill · 51 Distinct advertisement count · 1 March 2026 to 31 March 2026 |
| April 2026 | Adelaide · ads naming an AI skill · 64 Distinct advertisement count · 1 April 2026 to 30 April 2026 |
| May 2026 | Adelaide · ads naming an AI skill · 53 Distinct advertisement count · 1 May 2026 to 31 May 2026 |
| June 2026 | Adelaide · ads naming an AI skill · 70 Distinct advertisement count · 1 June 2026 to 30 June 2026 |
| July 2026 | Adelaide · ads naming an AI skill · 53 Distinct advertisement count · 1 July 2026 to 31 July 2026 |
| August 2026 | Adelaide · ads naming an AI skill · 58 Distinct advertisement count · 1 August 2026 to 31 August 2026 |
| September 2026 | Adelaide · ads naming an AI skill · 64 Distinct advertisement count · 1 September 2026 to 30 September 2026 |
| October 2026 | Adelaide · ads naming an AI skill · 76 Distinct advertisement count · 1 October 2026 to 31 October 2026 |
* Based on a small sample. Use with caution.
Each point uses its full calendar month and the population in the key. Dated observations and sample sizes are in the table.
Citation
AI Jobs Index Australia. Technology job ads by month. Adelaide · technology job ads. Period: 1 November 2025 to 31 October 2026. Validated refresh 19 November 2026. Accessed 20 November 2026. Data source: Lightcast. Observed postings through 17 November 2026. Source delivery 19 November 2026. Published by Building Tech Teams. https://www.aijobsindex.com.au/locations/cities/adelaide#technology-monthly-counts
Full calendar months.
All-ad base: 409. Without recorded skills: 2*.
All-ad base: 430. Without recorded skills: 2*.
All-ad base: 399. Without recorded skills: 2*.
All-ad base: 403. Without recorded skills: 4*.
All-ad base: 264. Without recorded skills: 0.
All-ad base: 342. Without recorded skills: 2*.
All-ad base: 411. Without recorded skills: 4*.
All-ad base: 518. Without recorded skills: 6*.
All-ad base: 511. Without recorded skills: 2*.
All-ad base: 468. Without recorded skills: 4*.
All-ad base: 523. Without recorded skills: 2*.
All-ad base: 404. Without recorded skills: 1*.
All-ad base: 486. Without recorded skills: 3*.
All-ad base: 521. Without recorded skills: 1*.
All-ad base: 527. Without recorded skills: 2*.
03
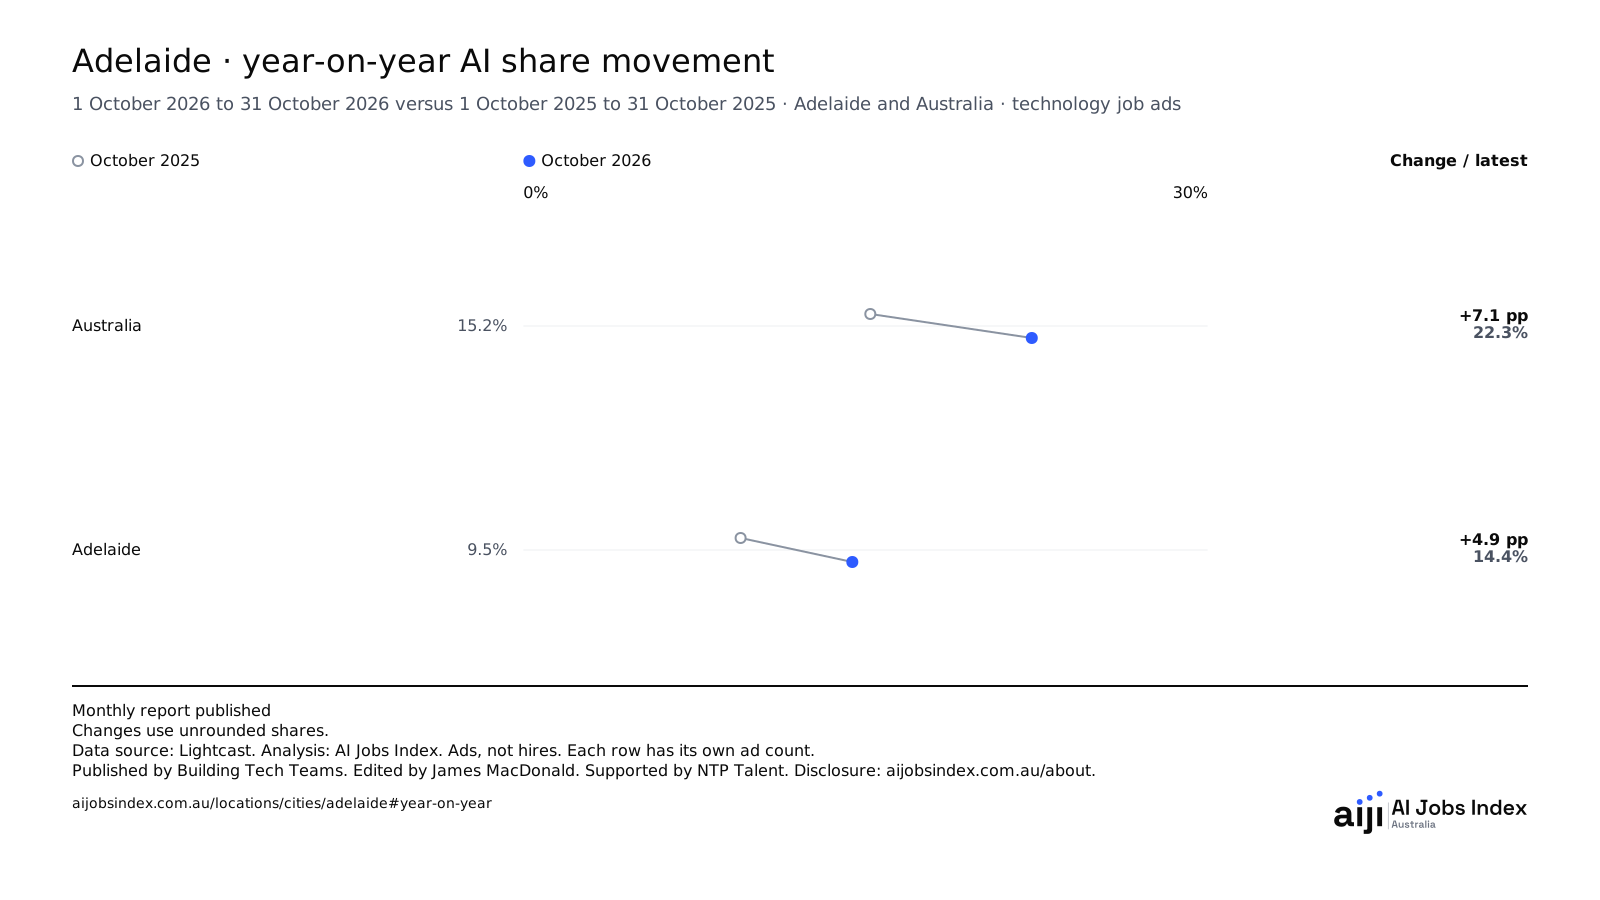
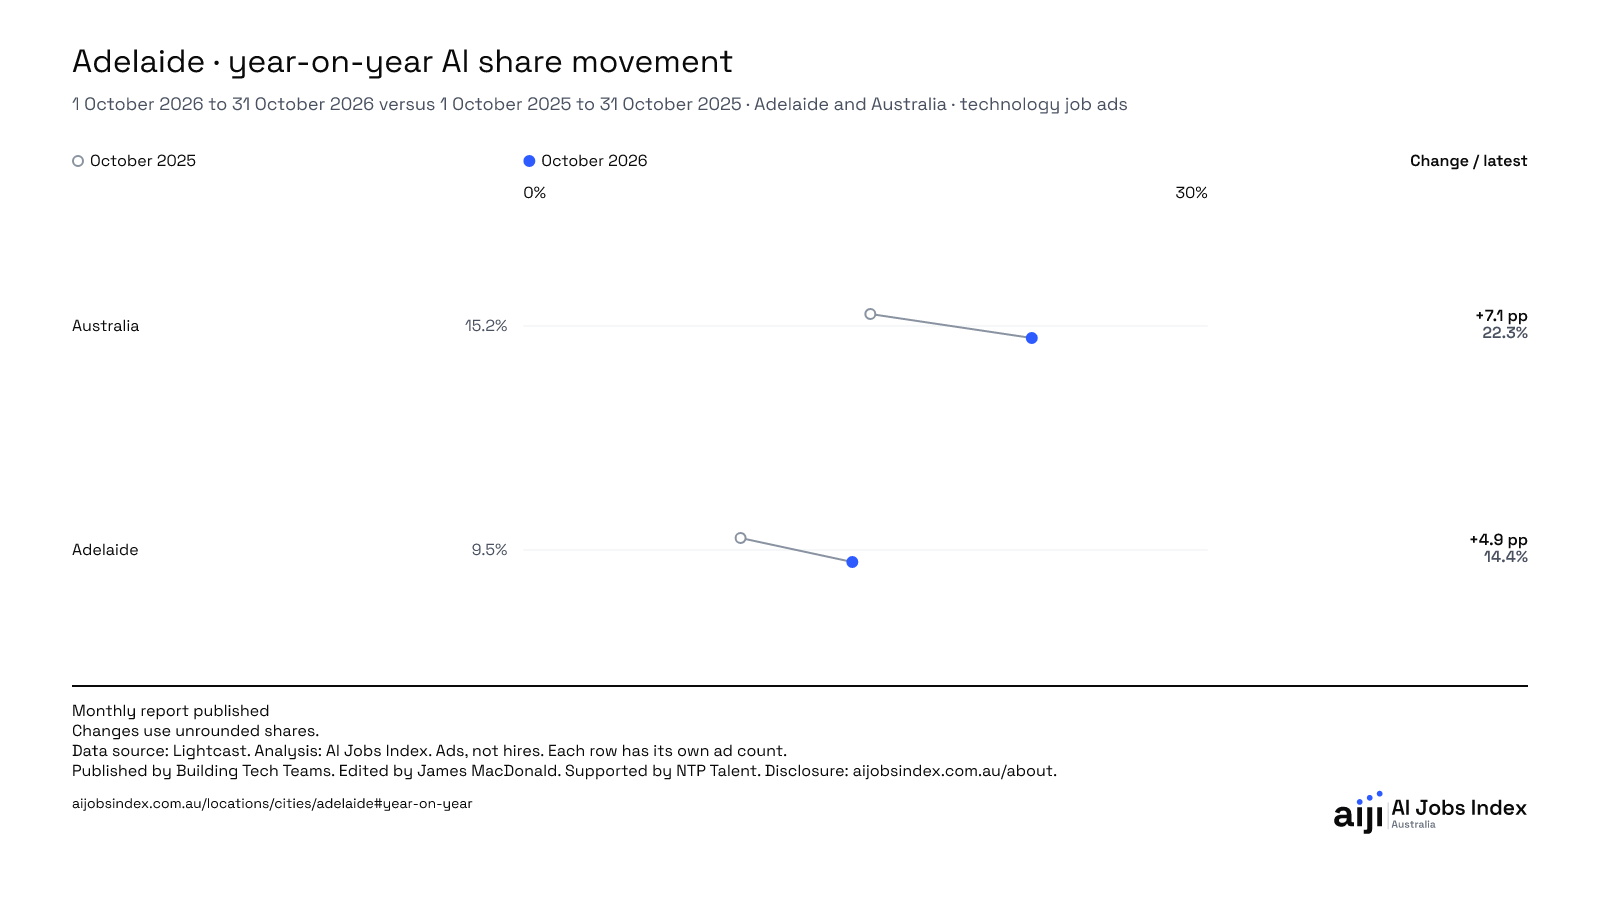
For Adelaide, the share rose from 9.5% to 14.4% (+4.9 percentage points).
Technology job ads. October 2026 versus October 2025. Data source: Lightcast.
Change uses unrounded shares.
| Location | October 2025 | October 2026 | Change (percentage points) |
|---|---|---|---|
| Australia | October 2025: 15.2% 1,573 of 10,342 job ads | October 2026: 22.3% 2,740 of 12,293 job ads | Change (percentage points): +7.1 pp |
| Adelaide | October 2025: 9.5% 38 of 399 job ads | October 2026: 14.4% 76 of 527 job ads | Change (percentage points): +4.9 pp |
Change uses unrounded shares.
Compares full calendar months. Change uses unrounded shares. Ads without recorded skills stay in the base. Small-sample shares stay in the evidence table. Movement requires two unflagged shares.
Citation
AI Jobs Index Australia. Adelaide · year-on-year AI share movement. Adelaide and Australia · technology job ads. Period: 1 October 2026 to 31 October 2026 versus 1 October 2025 to 31 October 2025. Validated refresh 19 November 2026. Accessed 20 November 2026. Data source: Lightcast. Observed postings through 17 November 2026. Source delivery 19 November 2026. Published by Building Tech Teams. https://www.aijobsindex.com.au/locations/cities/adelaide#year-on-year
Compares full calendar months. Change is in percentage points.
* Based on a small sample. Use with caution.
All-ad base: 399. Without recorded skills: 2*.
All-ad base: 527. Without recorded skills: 2*.
All-ad base: 10,342. Without recorded skills: 53.
All-ad base: 12,293. Without recorded skills: 36.
04
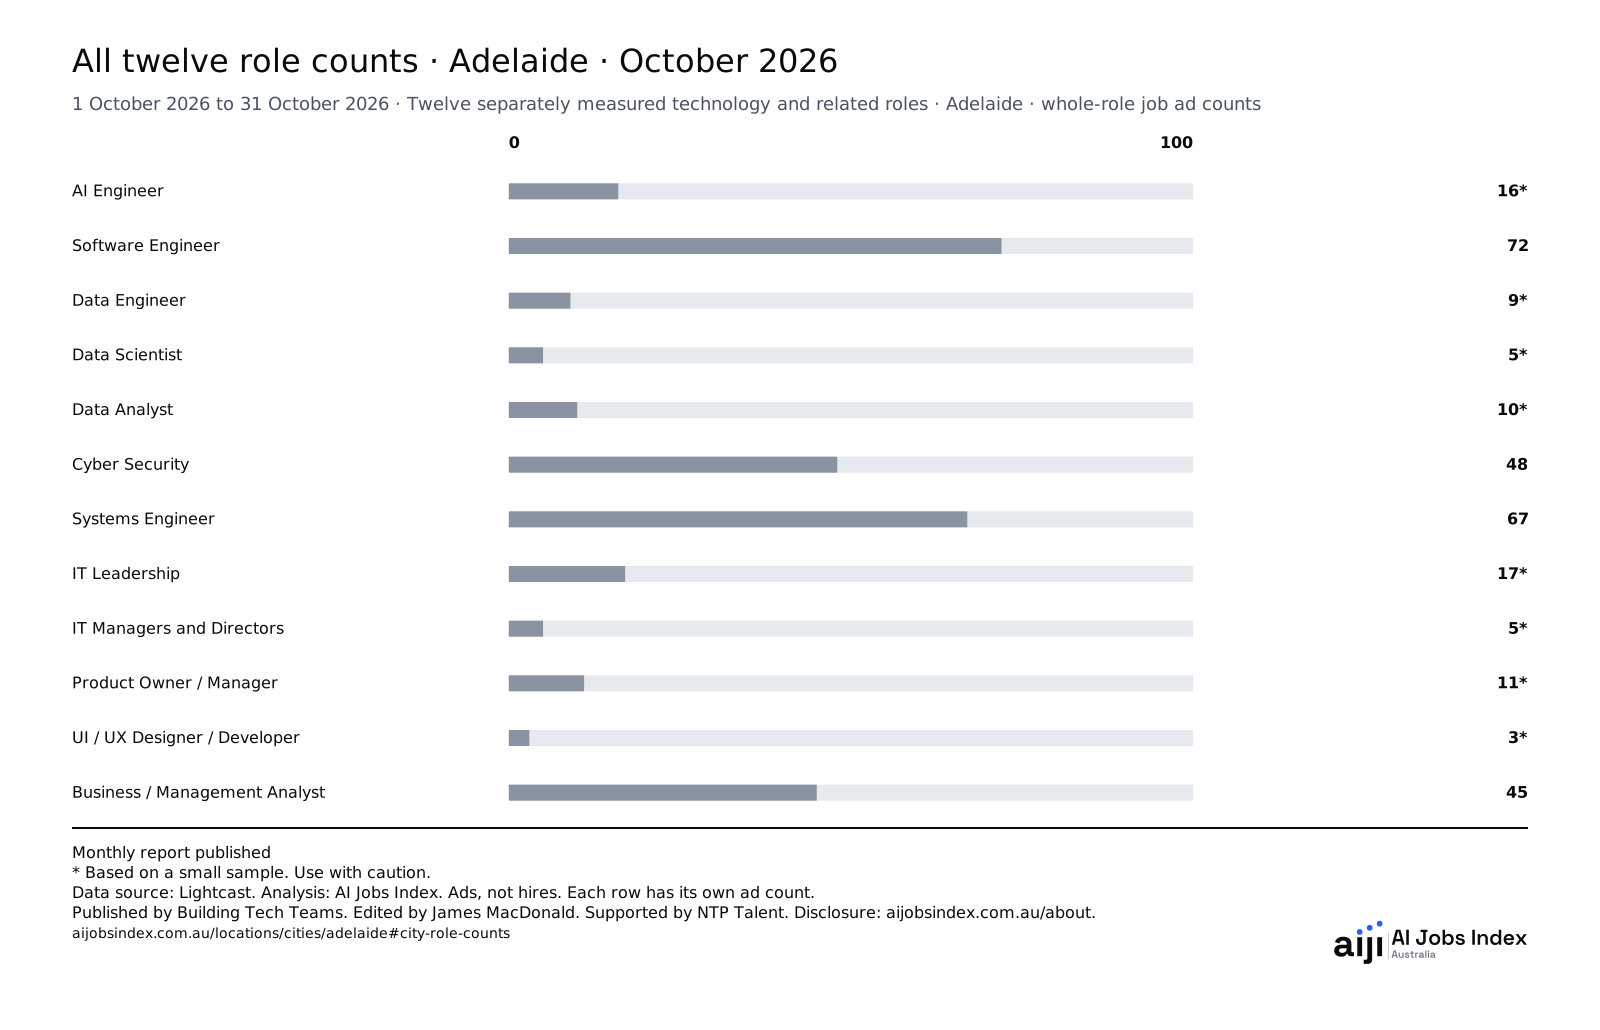
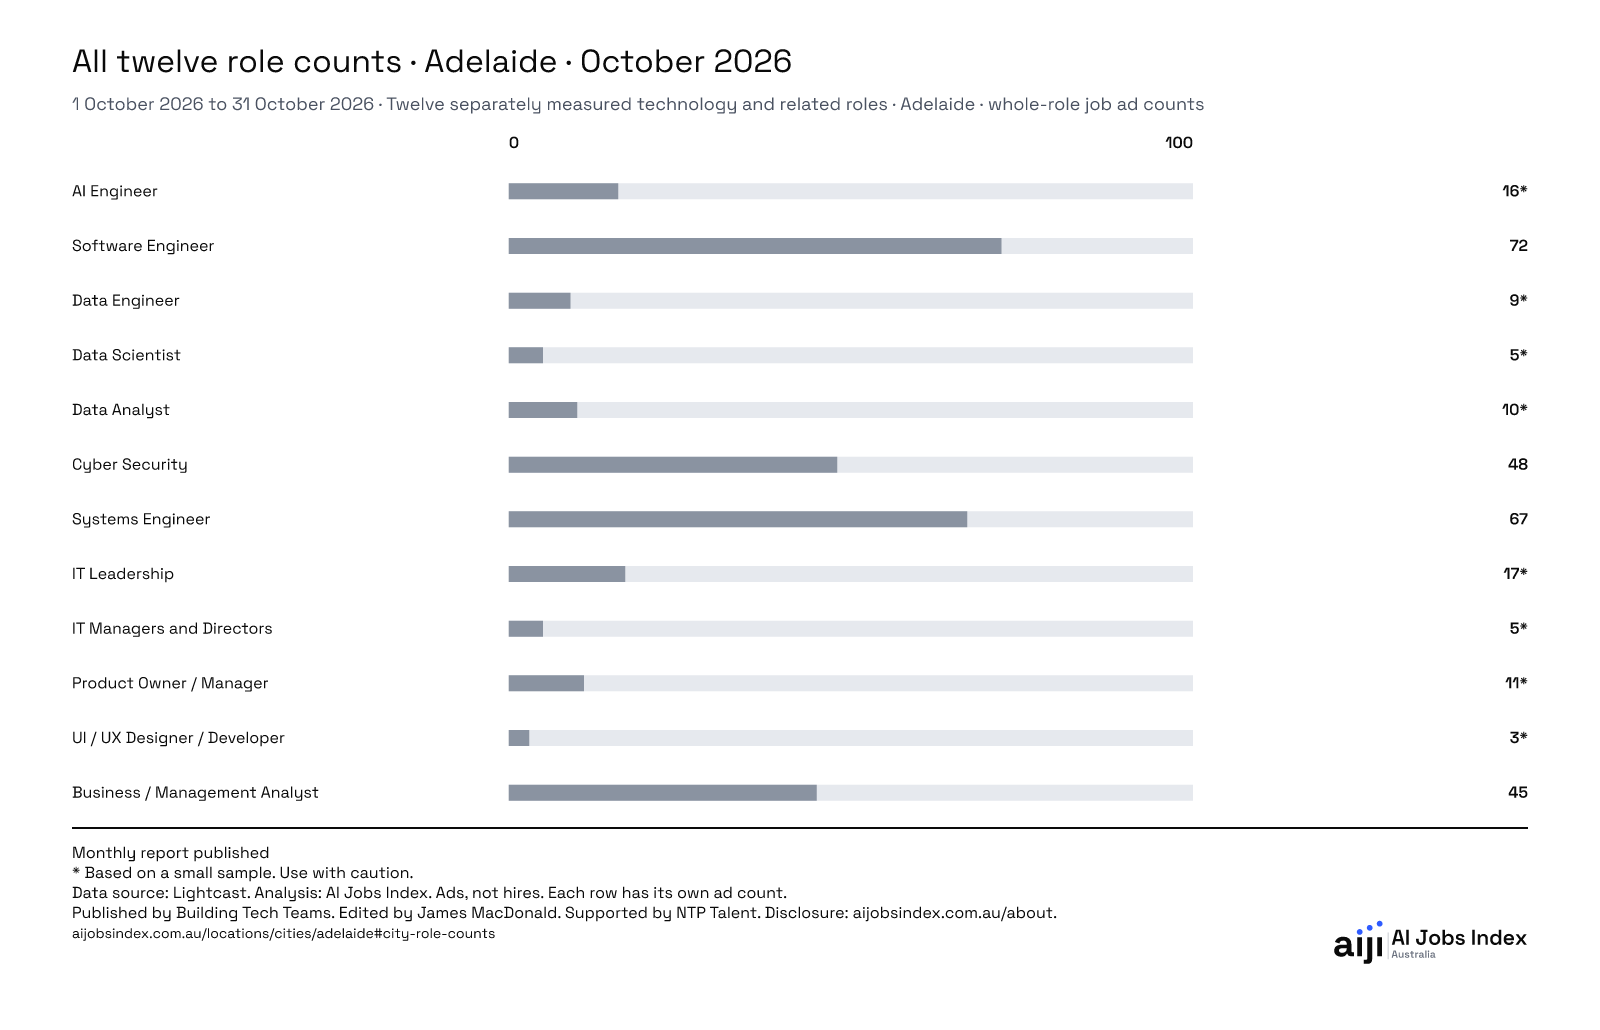
Software Engineer had the highest count in Adelaide, with 72 job ads.
Job ads for the twelve roles. October 2026. Data source: Lightcast.
* Based on a small sample. Use with caution.
| Entry | Reading and base |
|---|---|
| AI Engineer | 16* 16 whole-role ads (small sample) · 1 October 2026 to 31 October 2026 |
| Software Engineer | 72 72 whole-role ads · 1 October 2026 to 31 October 2026 |
| Data Engineer | 9* 9 whole-role ads (small sample) · 1 October 2026 to 31 October 2026 |
| Data Scientist | 5* 5 whole-role ads (small sample) · 1 October 2026 to 31 October 2026 |
| Data Analyst | 10* 10 whole-role ads (small sample) · 1 October 2026 to 31 October 2026 |
| Cyber Security | 48 48 whole-role ads · 1 October 2026 to 31 October 2026 |
| Systems Engineer | 67 67 whole-role ads · 1 October 2026 to 31 October 2026 |
| IT Leadership | 17* 17 whole-role ads (small sample) · 1 October 2026 to 31 October 2026 |
| IT Managers and Directors | 5* 5 whole-role ads (small sample) · 1 October 2026 to 31 October 2026 |
| Product Owner / Manager | 11* 11 whole-role ads (small sample) · 1 October 2026 to 31 October 2026 |
| UI / UX Designer / Developer | 3* 3 whole-role ads (small sample) · 1 October 2026 to 31 October 2026 |
| Business / Management Analyst | 45 45 whole-role ads · 1 October 2026 to 31 October 2026 |
* Based on a small sample. Use with caution.
IT Leadership is Lightcast’s Chief Information Officer occupation. It contains five specialised occupations: Chief Digital Transformation Officer, Chief Technology Officer, Chief Information Officer, Chief Data Officer and Chief Information Security Officer. IT Directors and IT Managers are counted separately, under IT Managers and Directors.
IT Managers and Directors is Lightcast’s IT Manager / Director occupation. It contains four specialised occupations: IT Manager, Technical Manager / Director, IT Operations / Networking Manager and IT Director.
Product Owner / Manager combines two Lightcast occupations: Product Manager, which Lightcast places in Marketing and Public Relations, and Product Owner, which Lightcast places in Information Technology and Computer Science. The combined role is separate from the technology job ads count.
All twelve roles retain their exact occupation/city boundary and matching full month. No sum of roles, city allocation, annual proxy or inferred missing zero is used.
Citation
AI Jobs Index Australia. All twelve role counts · Adelaide · October 2026. Twelve separately measured technology and related roles · Adelaide · whole-role job ad counts. Period: 1 October 2026 to 31 October 2026. Validated refresh 19 November 2026. Accessed 20 November 2026. Data source: Lightcast. Observed postings through 17 November 2026. Source delivery 19 November 2026. Published by Building Tech Teams. https://www.aijobsindex.com.au/locations/cities/adelaide#city-role-counts
12 of twelve matching monthly role/city observations are supplied. Each role is measured separately; these are not a partition of technology advertisements. Asterisks mark measured small samples. Missing and protected counts are kept separate. State, national and annual counts are never substituted.
All-ad base: 45. Without recorded skills: 0.
All-ad base: 10*. Without recorded skills: 0.
All-ad base: 5*. Without recorded skills: 0.
All-ad base: 16*. Without recorded skills: 0.
All-ad base: 9*. Without recorded skills: 0.
All-ad base: 3*. Without recorded skills: 0.
All-ad base: 17*. Without recorded skills: 0.
All-ad base: 5*. Without recorded skills: 0.
All-ad base: 67. Without recorded skills: 0.
All-ad base: 48. Without recorded skills: 0.
All-ad base: 72. Without recorded skills: 0.
All-ad base: 11*. Without recorded skills: 0.
05
Australia and Adelaide use the same period and measure.
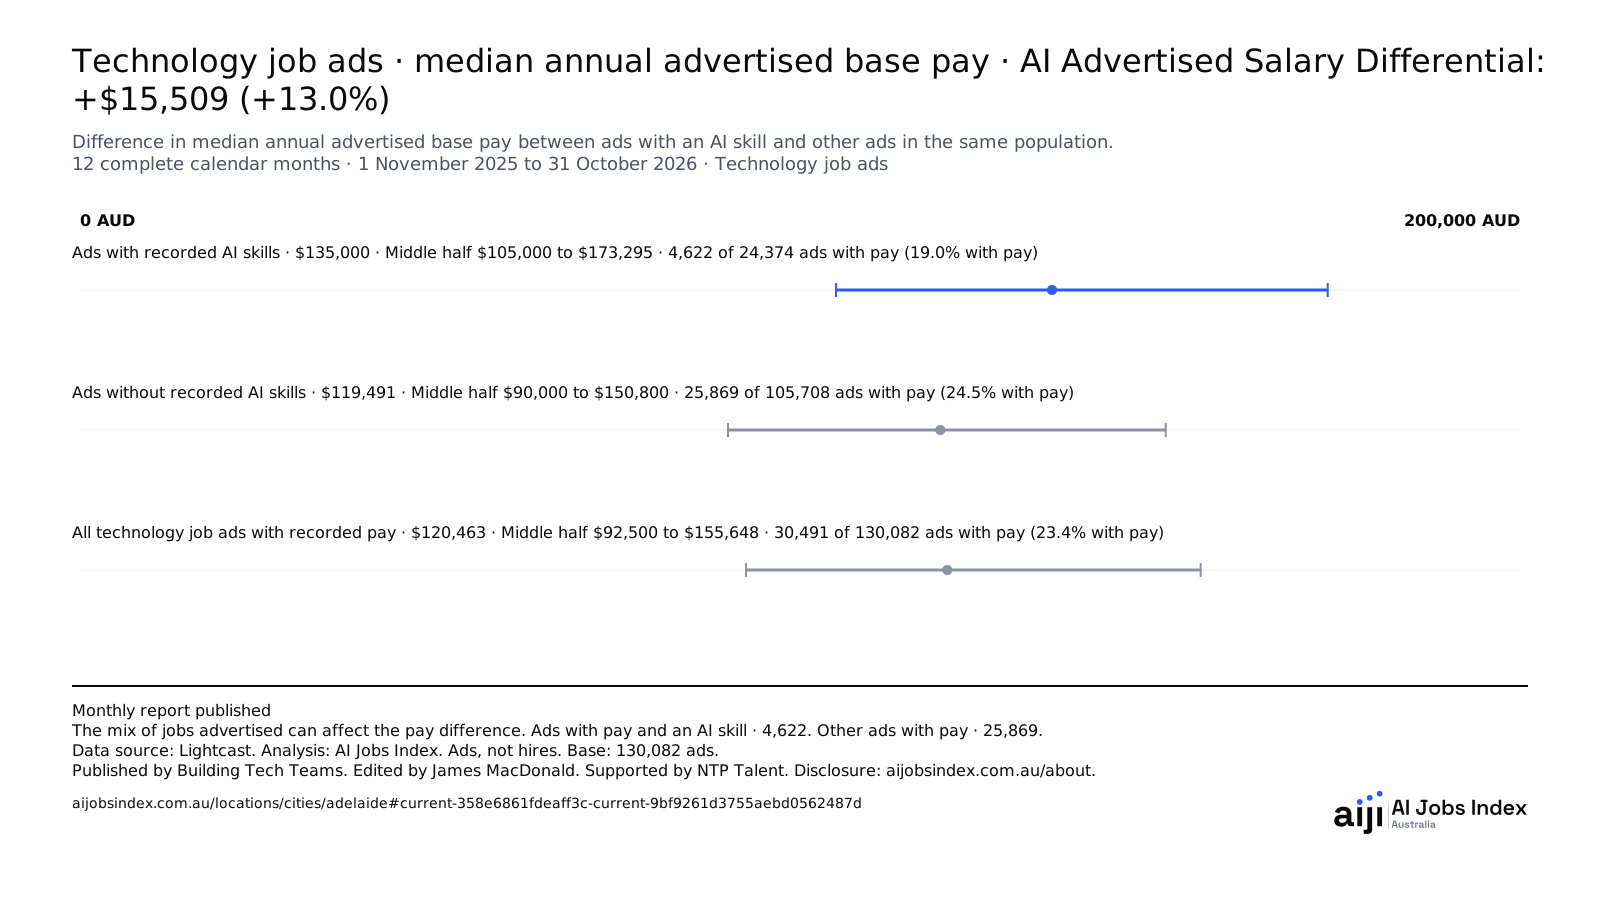
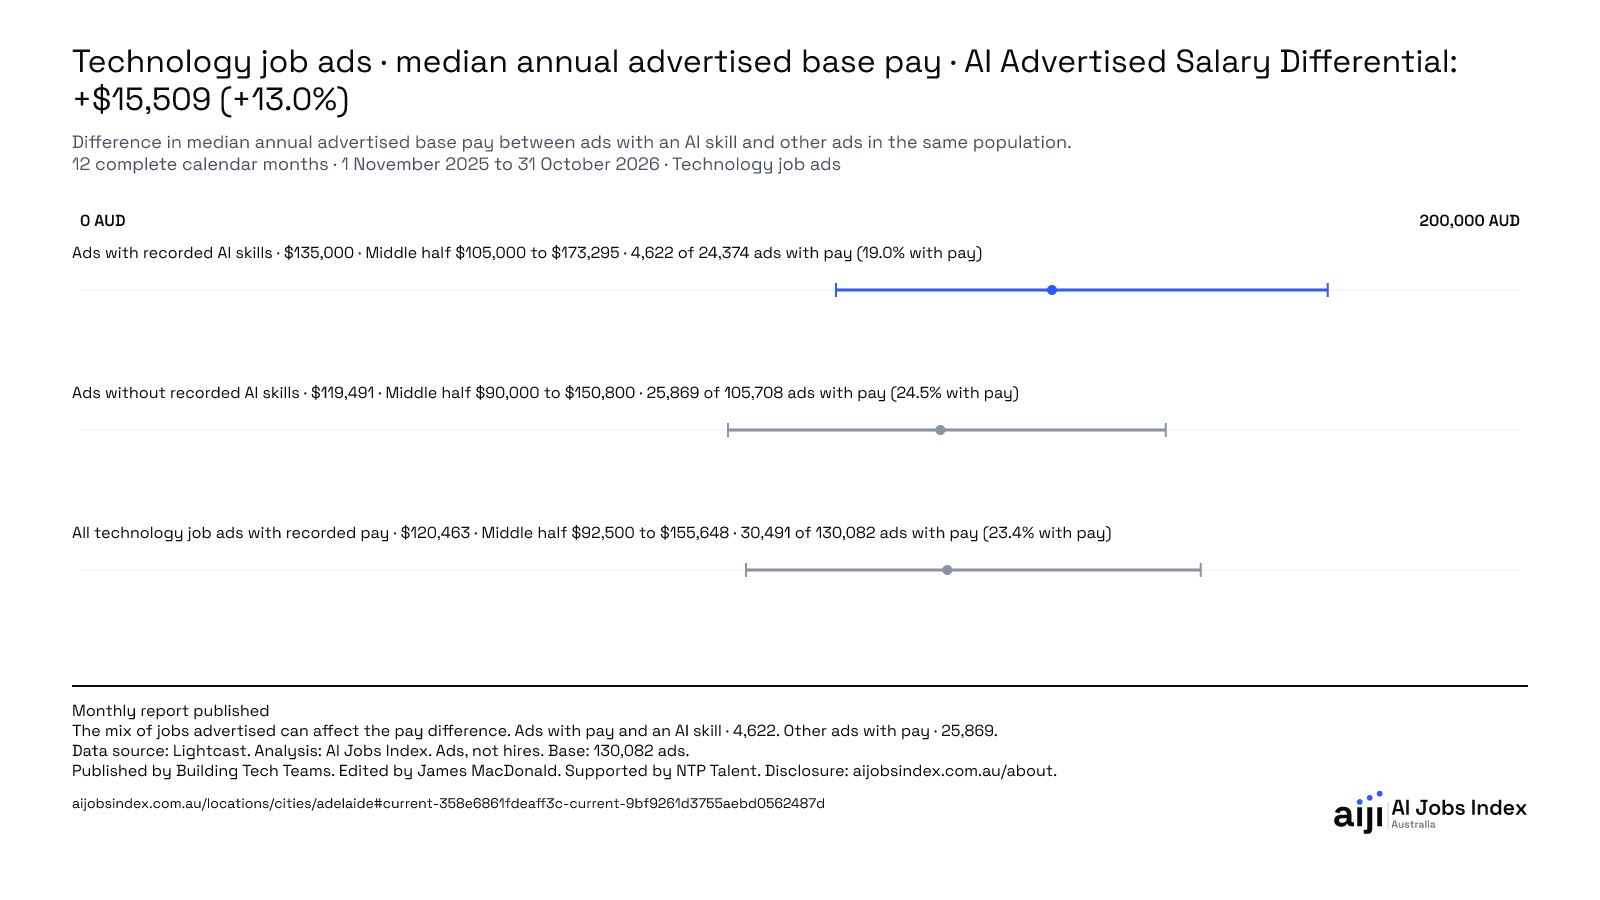
Median annual advertised base pay in Technology job ads was $135,000 for ads naming an AI skill, $119,491 for other ads and $120,463 for all technology job ads with recorded pay.
Last 12 months, finishing October 2026. Data source: Lightcast.
| Entry | Reading and base |
|---|---|
| Ads with recorded AI skills | $135,000 25th percentile: $105,000 · 75th percentile: $173,295 4,622 salary-bearing / 24,374 advertisements · 19.0% salary coverage |
| Ads without recorded AI skills | $119,491 25th percentile: $90,000 · 75th percentile: $150,800 25,869 salary-bearing / 105,708 advertisements · 24.5% salary coverage |
| All technology job ads with recorded pay | $120,463 25th percentile: $92,500 · 75th percentile: $155,648 30,491 salary-bearing / 130,082 advertisements · 23.4% salary coverage |
The range shows the middle half of annual advertised base pay. The filled dot marks the median. The end markers are offset so each value can be selected, even when the amounts are equal.
Each median uses only ads with recorded pay. Part-time figures show the annualised pay for the role as advertised. Differences can reflect the mix of jobs and seniority.
Exact dated population. Advertisements are not hires. Median annual advertised base pay in AUD excludes superannuation and benefits. Difference in median annual advertised base pay between ads with an AI skill and other ads in the same population. AI Advertised Salary Differential: +$15,509 (+13.0%). All ads with pay: 30,491. Ads with an AI skill and pay: 4,622. Other ads with pay: 25,869. Differences use the displayed whole-AUD medians. The 95% confidence range is +$15,142 to +$17,853. Fewer ads with pay or more variation in pay can widen the range.
Citation
AI Jobs Index Australia. Information Technology and Computer Science · median annual advertised base pay · AI Advertised Salary Differential: +$15,509 (+13.0%). Information Technology and Computer Science. Period: 12 complete calendar months · 1 November 2025 to 31 October 2026. Validated refresh 19 November 2026. Accessed 20 November 2026. Data source: Lightcast. Observed postings through 17 November 2026. Source delivery 19 November 2026. Published by Building Tech Teams. https://www.aijobsindex.com.au/locations/cities/adelaide#current-358e6861fdeaff3c-current-9bf9261d3755aebd0562487d
Australia and Adelaide use the same period and measure.
The 95% confidence range is +$15,142 to +$17,853. Fewer ads with pay or more variation in pay can widen the range.
| Cohort | Median | 25th percentile | 75th percentile | All ads | Ads with recorded pay | Salary coverage |
|---|---|---|---|---|---|---|
| With an AI skill | $135,000 | $105,000 | $173,295 | 24,374 | 4,622 | 19.0% |
| Other ads | $119,491 | $90,000 | $150,800 | 105,708 | 25,869 | 24.5% |
| All ads | $120,463 | $92,500 | $155,648 | 130,082 | 30,491 | 23.4% |
The 95% confidence range is +$6,405 to +$16,916. Fewer ads with pay or more variation in pay can widen the range.
| Cohort | Median | 25th percentile | 75th percentile | All ads | Ads with recorded pay | Salary coverage |
|---|---|---|---|---|---|---|
| With an AI skill | $117,059 | $96,549 | $134,732 | 626 | 154 | 24.6% |
| Other ads | $105,121 | $85,000 | $126,174 | 4,752 | 1,268 | 26.7% |
| All ads | $105,761 | $85,000 | $127,807 | 5,378 | 1,422 | 26.4% |
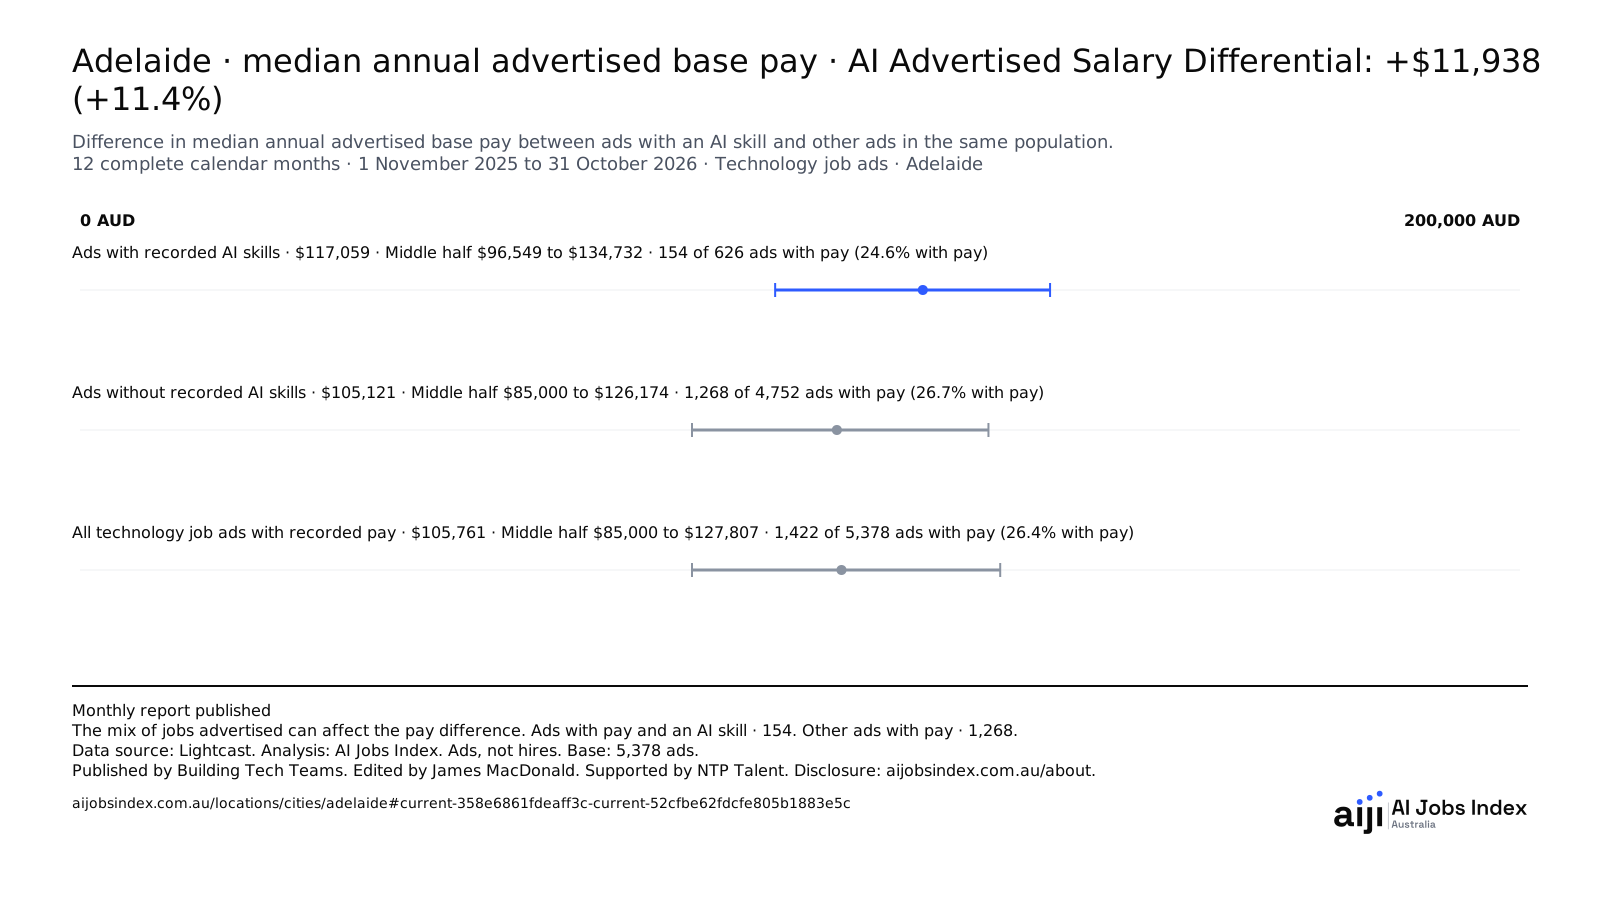
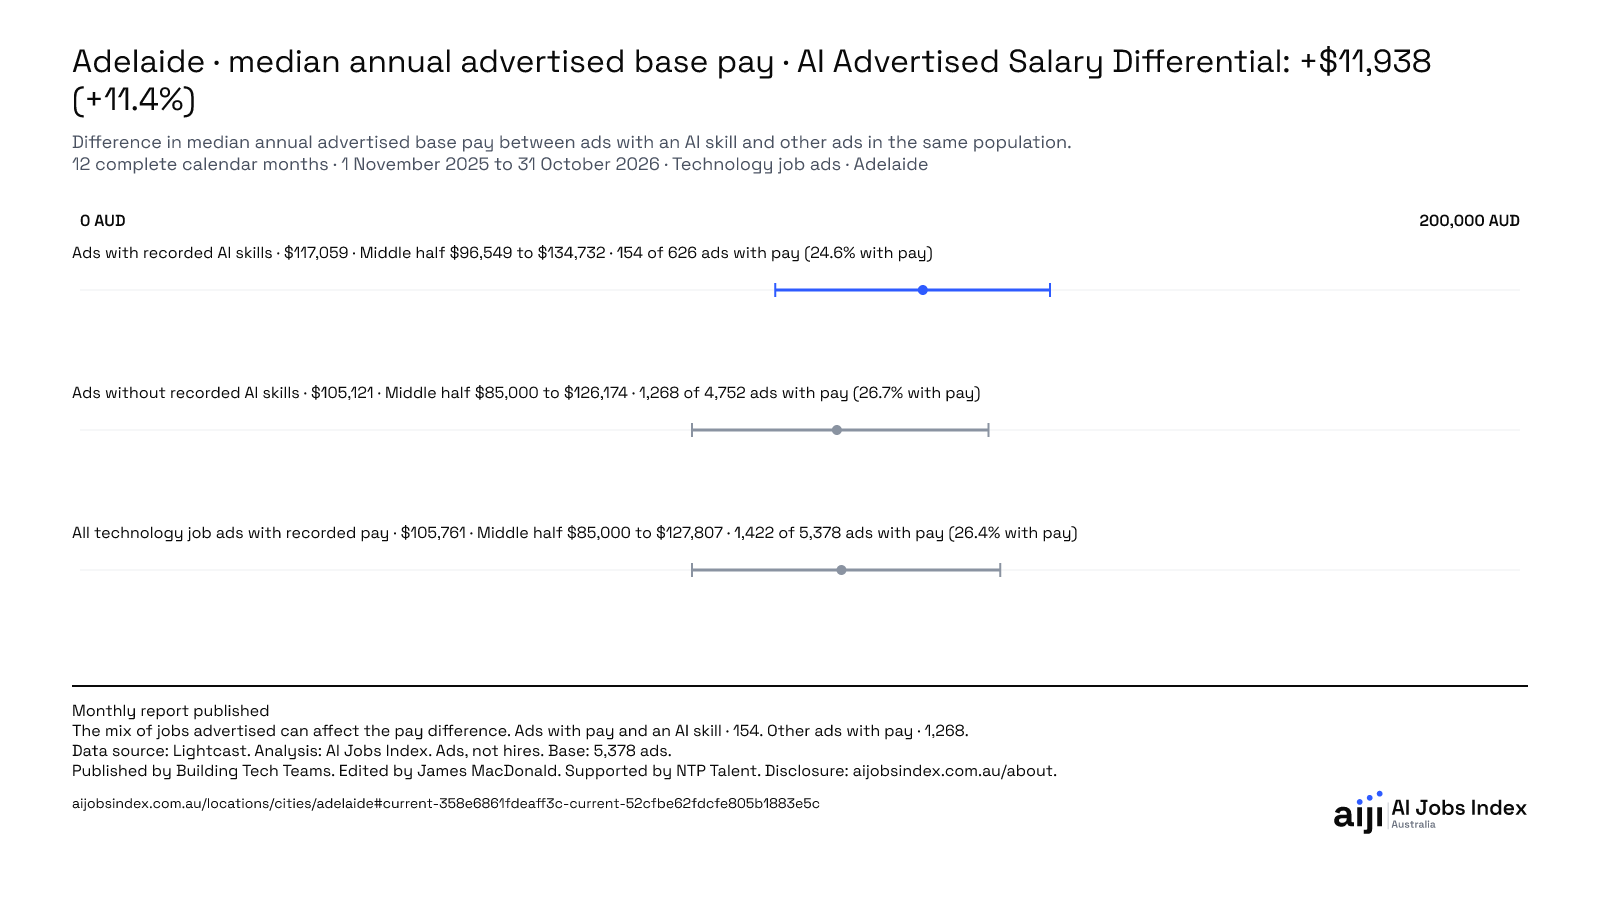
Median annual advertised base pay in Adelaide was $117,059 for ads naming an AI skill, $105,121 for other ads and $105,761 for all technology job ads with recorded pay.
Last 12 months, finishing October 2026. Data source: Lightcast.
| Entry | Reading and base |
|---|---|
| Ads with recorded AI skills | $117,059 25th percentile: $96,549 · 75th percentile: $134,732 154 salary-bearing / 626 advertisements · 24.6% salary coverage |
| Ads without recorded AI skills | $105,121 25th percentile: $85,000 · 75th percentile: $126,174 1,268 salary-bearing / 4,752 advertisements · 26.7% salary coverage |
| All technology job ads with recorded pay | $105,761 25th percentile: $85,000 · 75th percentile: $127,807 1,422 salary-bearing / 5,378 advertisements · 26.4% salary coverage |
The range shows the middle half of annual advertised base pay. The filled dot marks the median. The end markers are offset so each value can be selected, even when the amounts are equal.
Each median uses only ads with recorded pay. Part-time figures show the annualised pay for the role as advertised. Differences can reflect the mix of jobs and seniority.
Exact dated population. Advertisements are not hires. Median annual advertised base pay in AUD excludes superannuation and benefits. Difference in median annual advertised base pay between ads with an AI skill and other ads in the same population. AI Advertised Salary Differential: +$11,938 (+11.4%). All ads with pay: 1,422. Ads with an AI skill and pay: 154. Other ads with pay: 1,268. Differences use the displayed whole-AUD medians. The 95% confidence range is +$6,405 to +$16,916. Fewer ads with pay or more variation in pay can widen the range.
Citation
AI Jobs Index Australia. Adelaide · median annual advertised base pay · AI Advertised Salary Differential: +$11,938 (+11.4%). Information Technology and Computer Science · Adelaide. Period: 12 complete calendar months · 1 November 2025 to 31 October 2026. Validated refresh 19 November 2026. Accessed 20 November 2026. Data source: Lightcast. Observed postings through 17 November 2026. Source delivery 19 November 2026. Published by Building Tech Teams. https://www.aijobsindex.com.au/locations/cities/adelaide#current-358e6861fdeaff3c-current-52cfbe62fdcfe805b1883e5c
Each chart is available as an SVG and a PNG. The images include the period, group of ads and data source.